Sydney's population growth: How is it different from Melbourne?
Recently we published a blog about population change in Melbourne for the twelve months ended June 2012 – this time it’s Sydney’s turn. As we’ve blogged previously, Sydney and Melbourne have very different patterns of growth. Does this still hold true in 2012?
Sydney’s population in 2012
Sydney has been Australia’s largest city for much of the last 100 years, and it continues to hold this position. Sydney’s population reached 4.67 million at June 2012, an increase of some 61,300 persons on the year before. This translates to a growth rate of 1.3%, which is slightly less than the national figure. That Sydney is growing slower than Melbourne continues the trend established in the mid 2000s.
Patterns of growth and change in the Sydney metropolitan area
When I wrote a similar blog last year, I commented that Sydney does not have the very high rates of growth recorded on Melbourne’s fringe, and that growth overall was dispersed more evenly through the metropolitan area. This pattern still holds true for Sydney in 2012, as shown in the map below (click for larger version). Camden and Auburn were the only councils to record growth of more than 3% over the 2011 figure, but strong growth was also recorded in Canada Bay (2.6%), Sydney (2.3%) and Parramatta (2.1%). Of these, only Camden can claim to have development considered as greenfields growth – the drivers of population change in the other councils are as a result of housing development on key strategic sites eg Rhodes Peninsula in Canada Bay, Wentworth Point in Auburn.
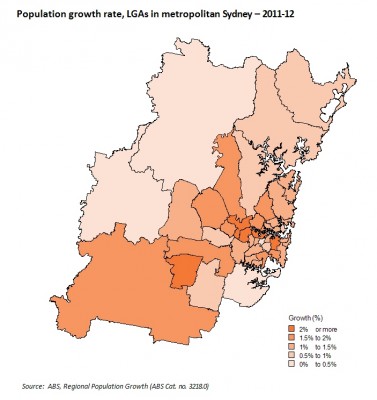
In contrast to Melbourne, all Sydney LGAs recorded population growth in 2011-12 – some only just. The outer western LGAs of Blue Mountains and Hawkesbury recorded very modest rates of growth (0.1% and 0.3% respectively). Unlike LGAs on Melbourne’s fringe, these are not designated growth area councils and both have environmental and topographical constraints to further large scale urban development. The settlement pattern in these LGAs is dispersed and still reflects their historic roots, eg settlement in the Blue Mountains generally follows the Great Western Highway. The other LGA to record modest growth was Sutherland Shire, located in the outer south. Its modest growth is more a reflection of an exhausted greenfield supply, relatively low levels of housing development and ageing households. Eventually this will lead to suburban regeneration and a potential wave of new growth, when these older and smaller households make way for younger families.
Blacktown
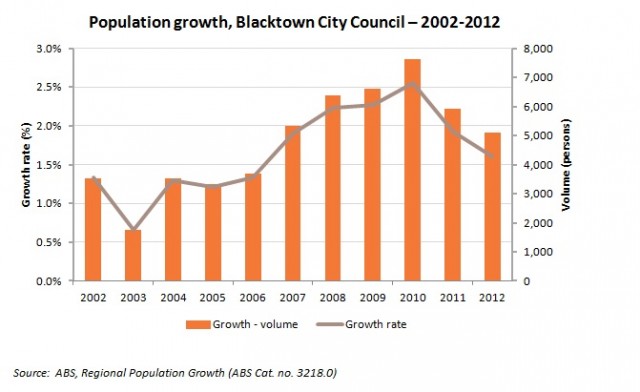
Though Sydney may not have LGAs recording very high growth rates, Blacktown City Council continues to grow strongly on the basis of new housing developments in greenfield areas. In 2011-12, Blacktown recorded a growth rate of 1.6%, but because it is a very large LGA (population approaching 318,000), the volume of growth was quite high (5,096) despite the comparatively smaller growth rate. Compare this volume of growth with Camden’s (2,075 people), which is Sydney’s fastest growing LGA. Blacktown’s growth (volume and rate) is shown in the chart below.
Blacktown’s development over many decades means that there are substantial variations in the rate of population change. Many suburbs, particularly those close to the railway line, and those developed before 2000 have relatively stable populations. In fact, almost half of Blacktown’s growth in 2011-12 was concentrated in the SA2 of Parklea-Kellyville Ridge. Notably, residential land supply in this area is becoming exhausted, and this will push the development fronts further to the north and west into Schofields and Riverstone. The population forecasts prepared by .id indicate considerable growth potential well into the future. This is simply due to the large amount of potential residential supply, and continuing demand for new housing on the urban fringe.
The $64,000 question – will the demographic story change?
As I described in the blog about Melbourne’s population growth, these figures are not the final – they are still preliminary. As previously blogged, the ABS will be releasing the final ERP estimates for 2011 in late August – the likely impact is that the numbers will change, but the overall trends won’t. Of greater interest, and potential impact, is the revision of ERP estimates for LGAs back to 2001. These changes have been necessitated by the new methodology employed for calculating the Census undercount in 2011, and the questions it raised as to the accuracy of these calculations in previous Censuses, and their subsequent impact on the ERP. We’ll need to wait and see, but as with the Melbourne blog, hopefully I won’t be rewriting it again!
Access our online demographic resource centre for more population and demographic information about your area. You may also wish to subscribe to our blog or monthly newsletter to receive the latest updates about Australia’s ever-changing population and demography. Or visit our website to learn about about .id the population experts.
![]()
Simone - Myth Buster
Simone has a rich background in human geography, demography and urban planning – a background that was useful in her previous roles in the Commonwealth and State Governments, and now as part of the forecast team at .id. From the Queensland coast to the southern suburbs of Perth, Simone produces population and dwelling forecasts that help local governments make informed decisions about future service and planning needs. She is a regular contributor to .id’s blog and has spoken at several conferences on how our cities and regions are changing. She is a big advocate of evidence-based planning and how Census and other data can inform this. Outside of work Simone is a keen traveller and photographer – interests that tie in well with her professional life and help her to understand “place”.