Sydney’s population – a story of consolidation
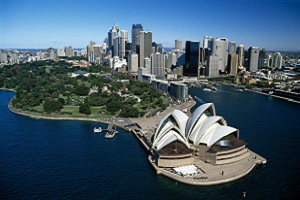
Sydney, Australia’s largest city and oldest European settlement, is also known as Australia’s world city, and the “city of cities”. It is the entry point of most new migrants to Australia, has the busiest airport in Australia, and iconic locations like the Sydney Harbour Bridge and the Opera House. This post looks at Sydney’s 2011 population, how it has changed and what the future holds for Sydney.
What is Sydney’s population?
The official population of Greater Sydney is currently (June 2011) estimated at 4,627,345 by the Australian Bureau of Statistics. This is a preliminary estimate which may be revised after the Census data comes out, but nevertheless is likely to be close to the mark.
Sydney in 2011 contained just over 20% of Australia’s population.
Sydney’s population has grown by 499,000 people in the 10 years since 2001. While this growth is lower than Melbourne’s, it is still substantial, representing growth of about 12% in 10 years.
It is important to remember how the ABS defines Greater Sydney. The region is called the Sydney Statistical Division, and extends across an area of more than 10,000 square kilometres. It includes some areas which many people wouldn’t regard as Sydney, including most of the Blue Mountains, and the Central Coast (Gosford and Wyong councils). Nevertheless these areas are all part of the CityRail network and many people commute into the City of Sydney from these places. Wollongong and Newcastle, though also on the CityRail network, are excluded from Sydney’s population, as they are large centres in their own right.
Where is growth occurring?
Sydney’s growth over the past 10 years has been quite different to Melbourne’s. Firstly, there are no LGAs with the truly massive percentage growth seen by places like Melton and Wyndham in Melbourne. The highest percentage growth over 10 years was 43%, and this was in the City of Sydney. Sydney’s growth hasn’t been dominated by the expansion of the urban fringe, but by infill, particularly in the inner city and suburban hubs.
The City of Sydney had the highest growth, at 43%. The City of Sydney covers much of the inner suburbs, and the growth includes apartment developments in the CBD, as well as major redevelopments like Green Square south of the city. Auburn Council had the second highest growth, at 37%. This is dominated by the Sydney Olympic Park area, Silverwater, Newington and Wentworth Point. Then comes Canada Bay with 30% growth, mainly in Rhodes and Liberty Grove apartment developments. In the past 3 years, Canada Bay and Parramatta have been the fastest growing areas, eclipsing the City of Sydney.
It is not until we get to the 4th spot that we find an urban fringe council, Camden, with 28% growth over 10 years.
This may be a little unfair – inner urban councils tend to be smaller and so can have high percentage growth more easily. When ranked in pure numerical terms, however, the City of Sydney still has the largest growth, followed by fringe areas Blacktown and The Hills. Shire.
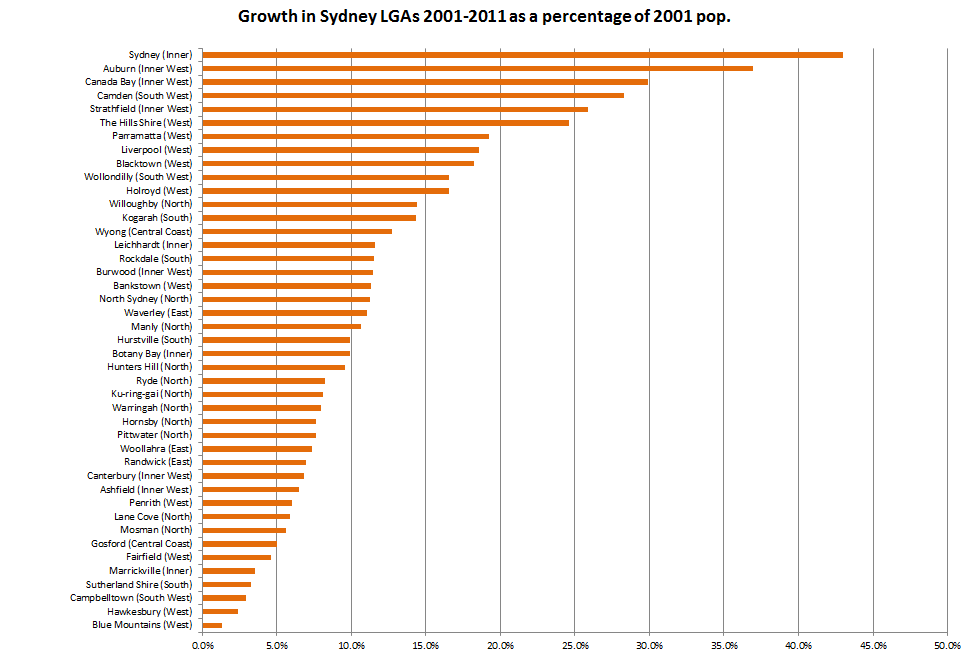
Source: Australian Bureau of Statistics, Regional Population Growth, Australia, 2010-11 (3218.0)
In 2001, Sydney was already by far the highest density city in Australia, and pioneered apartment living in the 1960s. This is clearly continuing apace. It is also known as a “city of cities”, as there are large high density suburban centres in Sydney which really aren’t present in any other Australian city. Of all Australian cities, Sydney is the only one that isn’t focused on a single core. Think of places like Parramatta, Auburn, Bankstown, Bondi Junction (Waverley) and Chatswood (Willoughby), which all have large dense centres, and all of which feature relatively high on the growth chart.
There are probably two major reasons for this.
1. Due to the size of Sydney and it’s geographic situation, the urban fringe in Sydney is a long way from the the city, much further than Melbourne (in Melbourne there are still some fringe areas in the west only 20km from the CBD, while in Sydney you pretty much need to go to 40km out to find the fringe, at places like Kellyville and Leppington). So the commute into the major employment areas from the urban fringe is much further, encouraging densification closer in as an alternative. The urban fringe growth is mainly driven by people who don’t work in the city but in one of the centres listed above.
2. Sydney is the multicultural hub of Australia, with huge populations from Lebanon, China, India and Vietnam to name just a few of the well established groups. Many of these cultures are accustomed to high density living and may be driving the growth in apartment living.
What will Sydney’s population look like in the future?
So what of the future? .id undertakes population forecasts for the whole of New South Wales, based on an average level of migration and region specific birth and death rates, as well as land availability assumptions for each area.
According to the forecasts, Sydney’s population, based on current boundaries will be about 6,140,000 in 2036, a growth of 1.5 million, or about 32% in 25 years.
The distribution of this growth is expected to change a bit, with some of the fringe areas coming to dominate again, as the bigger infill sites (eg. Olympic Park) fill up. In percentage terms, the largest growth will be in Camden, which is expecting a massive 254% increase (144,000 people). In raw number terms, however, the largest growth is in Blacktown (+171,000 or 55%). The urban consolidation areas including Sydney (+120,000, 63%), Parramatta (+56,000, 33%) and Auburn (+52,000, 67%) all continue to grow strongly, and are joined by the re-emergence of growth in places which haven’t grown much in recent years, such as Penrith (+54,000), Bankstown (+48,000) and Fairfield (+39,000). In contrast, little growth is expected in the smaller councils of the north shore (Mosman, Lane Cove, Hunters Hill), or in the Blue Mountains. High growth area of recent years, Canada Bay‘s growth tails right off as its development suburbs become full.
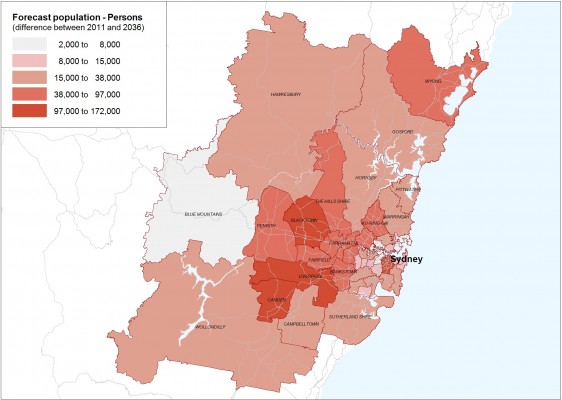
Source: .id consulting population and household forecasts, 2006-2036, released April 2012
Will Melbourne’s population overtake Sydney’s?
And the all-important question, how will Sydney and Melbourne’s populations compare in 2036? Our forecasts show Melbourne at 5,730,000 and Sydney at 6,140,000, so Sydney will still be larger, but Melbourne will close the gap to about 410,000 people, and this is still on the basis of the old definitions. With the official change to the boundaries of what is called “Greater Melbourne” and “Greater Sydney”, Melbourne picks up about 60,000 people currently, and this will probably grow to 100,000 extra by 2036. Sydney’s boundaries are barely changing in the new paradigm. So it is likely the difference in 2036 will be down to around 350,000 people, or about 6%. Sydney has been larger than Melbourne since about 1898 (Melbourne was bigger from about 1850 to 1898), and will continue to be bigger for the forseeable future. No other city in Australia will challenge Sydney or Melbourne in terms of population size. While Queensland will increase in population a lot, much of this will be outside Brisbane, and Perth will still be much smaller, at about 3 million.
If you would like to receive more updates about demographic or economic trends, do follow us on twitter @dotid or subscribe to our blog (above). You may also like to visit us at id.com.au where you can access our demographic resource centre.
Glenn Capuano - Census Expert
Glenn is our resident Census expert. After ten years working at the ABS, Glenn's deep knowledge of the Census has been a crucial input in the development of our community profiles. These tools help everyday people uncover the rich and important stories about our communities that are often hidden deep in the Census data. Glenn is also our most prolific blogger - if you're reading this, you've just finished reading one of his blogs. Take a quick look at the front page of our blog and you'll no doubt find more of Glenn's latest work. As a client manager, Glenn travels the country giving sought-after briefings to councils and communities (these are also great opportunities for Glenn to tend to his rankings in Geolocation games such as Munzee and Geocaching).


