Analysing Christchurch?s Population Change 2006-2013
On my recent Christmas break back in New Zealand, I was lucky to fly out of Christchurch on a beautiful sunny day and even luckier to have a window seat. The geographer/demographer in me was curious to see what is visible from the air in terms of demolitions and any new pockets of growth in my old university town. I did not see much of the large areas of demolished dwellings within the Christchurch Earthquake Recovery Authority’s (CERA) “red zones” as I was probably too busy playing with the entertainment console and choosing which episodes of Shortland Street I wanted to catch up on. However, I did see some new greenfield estates in the city’s north and further out of Christchurch. I knew where Pegasus Town was and this has been a new town under construction since 2006, but it was some smaller residential greenfield activity that interested me.
Upon returning to work, I had a look at the 2006 and 2013 population figures and made a few maps outlining which areas gained population and which areas lost population in this unusually long gap between Censuses (Stats NZ).
By comparing the Christchurch usually resident population figures in 2013 and 2006, some interesting and some expected changes can be seen in the sub-TA figures.
Christchurch as a city decreased in population by almost 7,000 residents from 348,456 in 2006 to 341,469 in 2013. By comparison, in the period between 2001 and 2006, Christchurch City gained 24,378 residents. These trends were expected to continue after 2006 and up until those earthquakes in September 2010 and more so 22nd February 2011, Christchurch was still a fast growing city. We have covered the February 2011 earthquakes in detail on the .id blogs before (in March 2011 and October 2012), so this population decrease was expected and since some time passed between the earthquakes (and initial out migration post-2011) and the 2013 Census, this population decrease was in the end less than originally expected with some ex-residents returning and some new residents moving to the City in that 2011-2013 period.
So what can be concluded from the maps seen below?
Red zoned areas along the Avon River to the east of the CBD have been decimated since the earthquakes and the subsequent decision to have these areas red zoned (buildings with extensive area wide land damage, high risk of further damage from further shaking, uneconomic/uncertain of possible repair). Two examples of such areas are seen below, the suburb of Bexley and the Horseshoe Lake part of Burwood. These suburbs have experienced huge losses in population as a result of planned demolitions. The Bexley East population plummeted from 2,700 in 2006 to 1,059 in 2013 (-61% decrease). In fact, if it wasn’t for the western section of the suburb (still standing) being included in this area total, the population decrease for Bexley East would be from 1,554 to 111 in 2013 (-93% decrease).
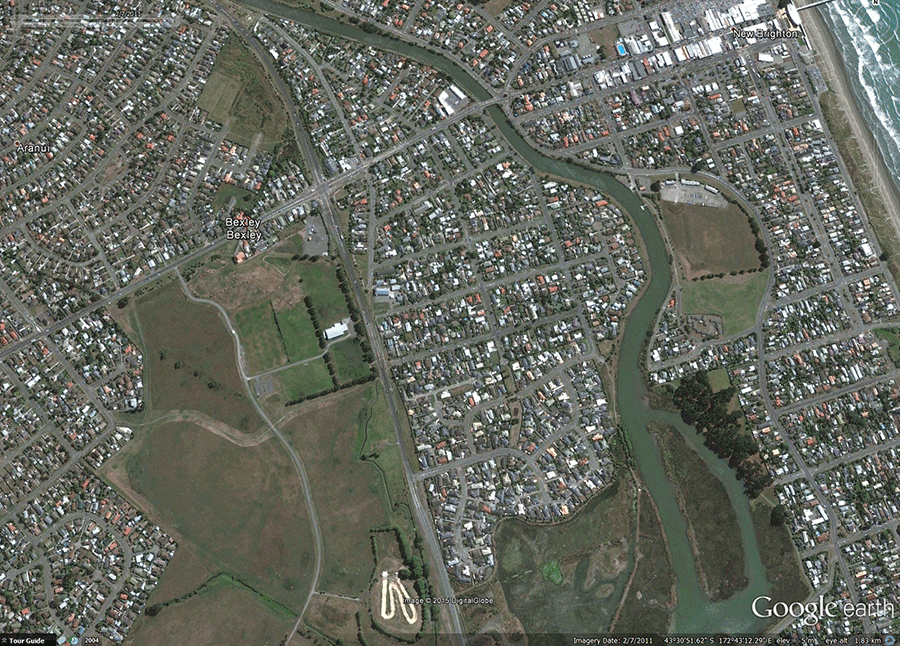
The suburb of Bexley, 7th February 2011 (Source: Google Earth) – click on image to enlarge.
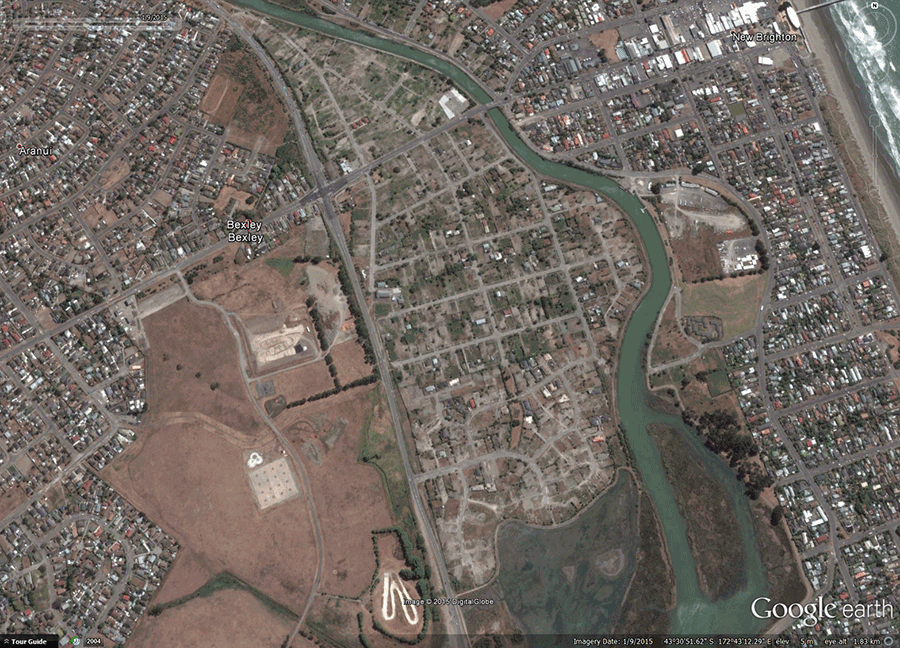
The suburb of Bexley, 9th January 2015. Widespread demolitions of earthquake-damaged dwellings are visible. (Source: Google Earth) – click on image to enlarge.
The Horseshoe Lake part of Burwood decreased from 2,874 in 2006 to 1,062 in 2013 (-63% decrease). That whole part of Burwood as well as Dallington (to the south), Avondale (below Dallington) and Avonside (across the Avon to the east from Burwood/Dallington) experienced the largest population losses after the earthquakes. If you have a mapping product such as Google Earth which allows viewing of aerial imagery over time, you can clearly see exactly how much has been lost in terms of housing stock in this pocket of eastern Christchurch.
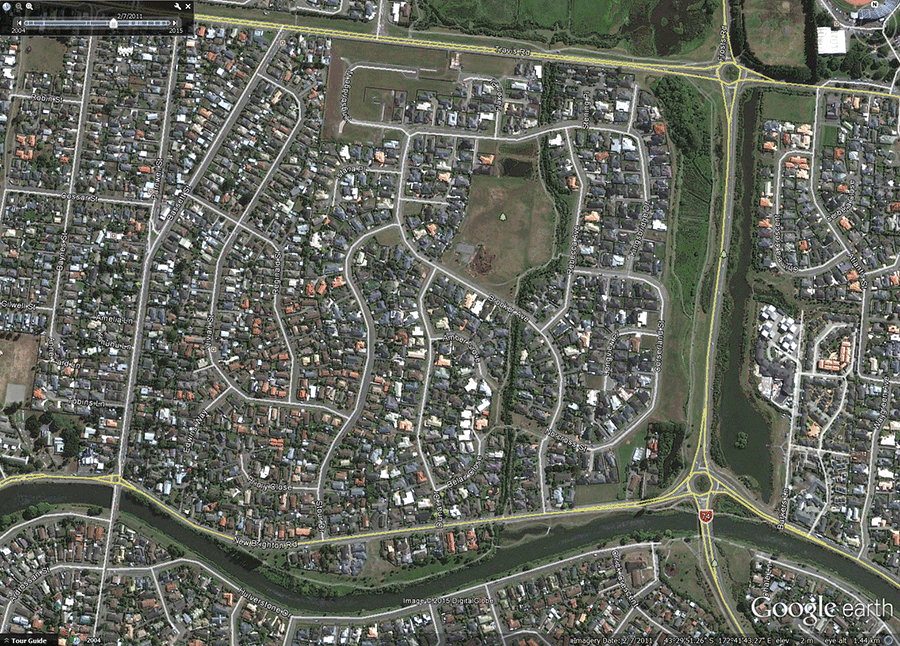
The suburb of Burwood, 7th February 2011. (Source: Google Earth) – click on image to enlarge.
The suburb of Burwood, 9th January 2015. As with Bexley, widespread demolitions of damaged dwellings have resulted in large population losses. (Source: Google Earth) – click on image to enlarge.
The Christchurch CBD, where most of the loss of life was concentrated on the 22nd of February in 2011, also experienced notable population loss. The city centre was blocked off after the earthquakes and these cordons, continually guarded by soldiers and other staff for nearly 860 days, stayed in place until the end of June 2013. The four area units which comprise the CBD (bordered by the “four avenues”) lost 2,793 usual residents (from 7,686 in 2006 down to 4,893 in 2013). Once final plans for the CBD and surroundings are decided on, we will have a better idea as to what/if any future residential development will occur in this area that would result in a population increase.
As I mentioned before, many of these population losses were anticipated even before the official figures were released in 2013. What wasn’t initially clear was where growth would occur. Which areas would accommodate for those who had to leave affected parts of Christchurch? Anecdotal evidence pointed to areas such as Rolleston and the outer suburbs of Christchurch and satellite towns such as Halswell or Prebbleton growing in size.
Listed below are some noteworthy areas which experienced population growth in the 2006-2013 period with some commentary as to why this occurred. The notes below accompany these maps which depict absolute population change and percentage change in population between 2006 and 2013 in Christchurch City and the immediate greater region.
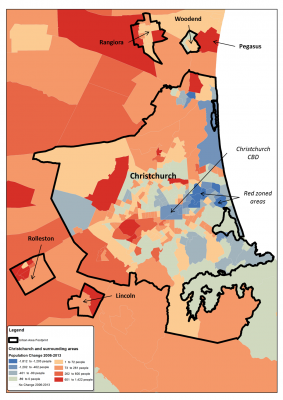
Christchurch City and surrounding townships/settlements – absolute population change between 2006 and 2013 – click on image to enlarge.
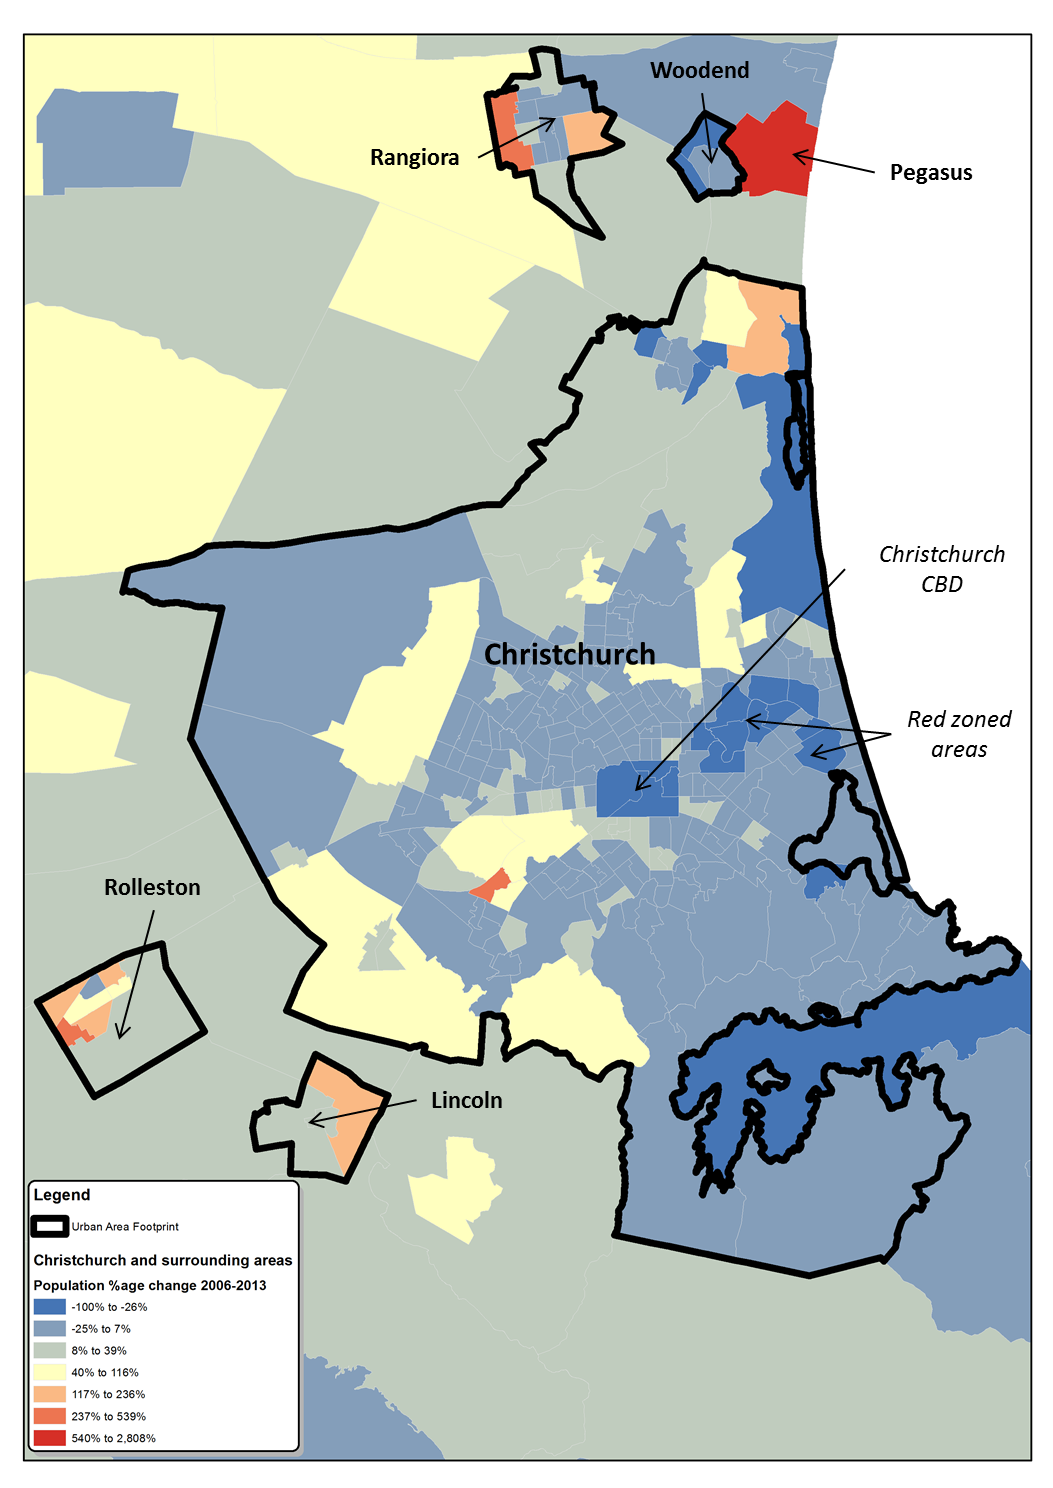
Christchurch City and surrounding townships/settlements – population percentage change between 2006 and 2013 – click on image to enlarge.
Within the Christchurch urban area:
- Northwood – The outer suburb of Northwood saw greenfield development commencing prior to 2006 and this trend of new dwelling additions continued to 2013 with some more potential capacity opening up to the north of the now established suburb. The suburb of Northwood saw a combined population gain of approximately 1,090 people in the 2006-2013 period (based on area unit figures).
- Mairehau North – The suburb of Mairehau has seen an addition of 750 residents in the 2006-2013 period, largely due to the development of the Diana Isaac Retirement Village and the commencement of a greenfield residential estate to the east of the retirement village.
- Yaldhurst – The outer Christchurch suburb of Yaldhurst experienced growth in the form of 747 new residents in the 2006-2013 period mainly in the southern part of the suburb which commenced development in 2008.
- Wigram – The southwestern outer suburb of Wigram recorded a high population gain of 1,203 people in the 2006-2013 period, mainly as a result of the Wigram airport redevelopment which under the name “Wigram Skies” plans to construct 1,600 residential sections on the former RNZAF base. Although the groundwork began in 2010, commencement of dwelling additions (and occupation of these by residents) did not begin until 2012 and will continue into the late 2010s.
- Aidanfield – To a lesser extent than Wigram, just across the Christchurch Southern Motorway, the suburb of Aidanfield has also experienced a growth in population of almost 390 people as a result of greenfield development.
- Kaiapoi – The satellite town of Kaipapoi in the northern Waimakariri District has experienced both a loss and a gain in population in different parts of the township. South and immediately north of the Kaiapoi River, extensive earthquake damage (CERA has “red zoned” these parts) has resulted in a population loss of 2,007 people in the 2006-2013 period. However, the northeast section of the township has experienced a lot of greenfield development in the last few years, resulting in a gain of almost 670 people in the 2006-2013 period and judging by the January 2015 aerial imagery, there is another 30-35% of additional population gain to come. It is also worth mentioning that Brooklands, the northernmost suburb of Christchurch, located on the southern banks of the Waimakariri River is another CERA red-zoned area which has lost a significant amount of housing stock following the post-earthquake demolitions. Being so close to the “growth area” of Kaipoi, the loss of housing stock in Brooklands and subsequent demand for housing of residents could be another reason why the steady growth in nearby Kaipoi North East (about 2.5km north) has occurred and is expected to continue.
Outside the Christchurch urban area:
- West Melton (Selwyn District) – To the west of Christchurch, the township of West Melton has had significant greenfield development either side of Weedons Ross Road with an increase in population of 654 people in the 2006-2013 period and more to add before the next Census.
- Fernside – East of Rangiora, rural residential-style properties have resulted in a population gain of 603 between 2006 and 2013. Most of this development, however, did occur between 2007 and 2008 so not a lot of evidence to suggest that the population growth here was a result of post-earthquake development.
- Lincoln East – Southwest of Christchurch within the town of Lincoln, there was a large post-2006 population gain, namely the result of greenfield development above and below Edward Street which will continue post-2015.
- Rolleston – The town of Rolleston (also southwest of Christchurch) has almost doubled in population during the 2006-2013 period (from 4,929 to 9,543 residents). Most greenfield residential development has been happening in the block between Lower Road and State Highway 1 during this time.
- Rangiora – The town of Rangiora, north of Christchurch, has experienced population growth in the 2006-2013 period mainly in the eastern and western parts of the township. To the west, a lot of growth began prior to 2006, continued through to 2013 and looks to continue past 2015 based on recent aerial imagery. This western part of Rangiora grew by 1,422 people from 264 in 2006 to 1,686 in 2013 (five-fold increase). This is the largest absolute population increase in the entire Canterbury region. The eastern development activity was concentrated south of Kippenberger Avenue and began with a greenfield estate developing from 2006-2011 before another estate further east commenced in 2012. This addition of new residential dwellings to the area resulted in a population increase of almost 800 in the 2006-2013 period. These two areas contributed to just over 76% of the 2,865 additional residents living in Rangiora from 2006-2013.
Looking to the future…
The future of Christchurch City and the greater Christchurch region certainly looks to continue being dynamic and with so many areas of change shaping how suburbs will develop, appear, interact and connect with each other and the rest of the city in the future – it indeed pays to think ahead and work to create a functional and robust city which will meet the short term needs of residents who are still recovering from the effects of natural disaster as well as establishing and positioning Christchurch and the region as ready to accommodate future residents of “The Garden City” and allow the area to develop and thrive as the South Island’s largest city. With a few strategic development plans, such as the “Greater Christchurch Urban Development Strategy” and the Christchurch City Council’s “Christchurch Central Recovery Plan” already in place, here is hoping for a bright and prosperous Christchurch in the future.
Nenad Petrović
Nenad’s background is in geosciences and geographic information systems. At .id, Nenad has experience as both as a demographer and population forecaster. His areas of expertise are place-based analysis, identifying spatial patterns in demographic trends, community profiling, catchment analysis and an understanding of role and function of different communities.


