Of the people who live in your area, how many work locally? Are there enough local jobs for your residents? Do local jobs meet the needs of your residents?
As planners and economic developers work toward 20-minute cities, new data from the ABS Census helps answer these questions.
Back in 2018, Glenn wrote about how to use employment self-containment to identify if there are enough local jobs for your residents. This blog provides an update of this with the latest 2021 ABS Census of Population and Housing.
What is self-containment?
Employment self-containment is defined as the proportion of individuals living and working in the same region. It indicates the propensity of residents to work closer to home. On the flip side it tells us about the propensity to seek employment outside their region in which they live.
How is the data collected?
Place of work data, which is used to estimate self-containment, is drawn from responses to the ‘Business name’ and ‘Workplace address’ questions on the Census form about the main place of work for the respondent in the last week.
Did people list their home address as their workplace address?
It doesn’t look like it. The ABS looked at the proportion of people who listed the same mesh block for their usual residence and place of work and found that it was largely unchanged between 2016 (7.3%) and 2021 (8.4%). Given so many people were experiencing COVID-19 restrictions on Census Night, this suggests that most people listed their employer’s usual workplace address even if they worked from home due to COVID-19 restrictions.
While this is good news about the quality of place of work data, careful analysis is still required when interpreting the results due to the impact COVID-19 had on employment (e.g. industry impacts, hours worked, commuting patterns, method of travel).
What influences self-containment at the LGA level?
Self-containment varies considerably between regions and is influenced by:
- The nature of local employment opportunities versus the skills and qualifications of residents;
- Transport options available and commuting times;
- Relationship between wages and salaries and house prices in the area; and
- The geographic size of the area
Why does it matter?
One of the often-stated goals of local government economic development is to maximise self-containment of employment. In our cities, a lot of employment is concentrated in just a few areas. This creates a range of issues including:
- road and public transport congestion;
- reduced labour force participation; and
- reduced quality of life
Employment self-containment can also be used to examine if local jobs meet the needs of residents (e.g. skills, occupations, income, full time, etc).
So, the goal of self-containment is to create jobs in the area which employ local people, becoming more economically, socially and environmentally sustainable. And as we found during covid-19 restrictions, more local workers can help increase activity at local shops and cafes.
Now a word of caution on this. While self-containment of employment is a reasonable goal to have, using Local Government boundaries may not be the best way to measure it. It is also useful to consider employment opportunities in the surrounding region, especially if it is within a 20 minute catchment of your LGA. You can examine this using the maps on “Residents by place of work”. This map can show which industries people need to travel to find work, and which industries people find work in the local and nearby areas.
Analysing self-containment using economy.id
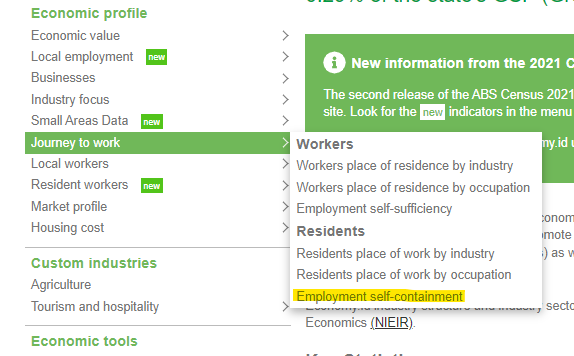
Self-containment in economy.id is included under “Journey to work -> Residents -> Employment self-containment” menu item in economy.id.
For this example we’ll look at the Central Coast Council Area, NSW, but this applies to any council subscribing to economy.id.

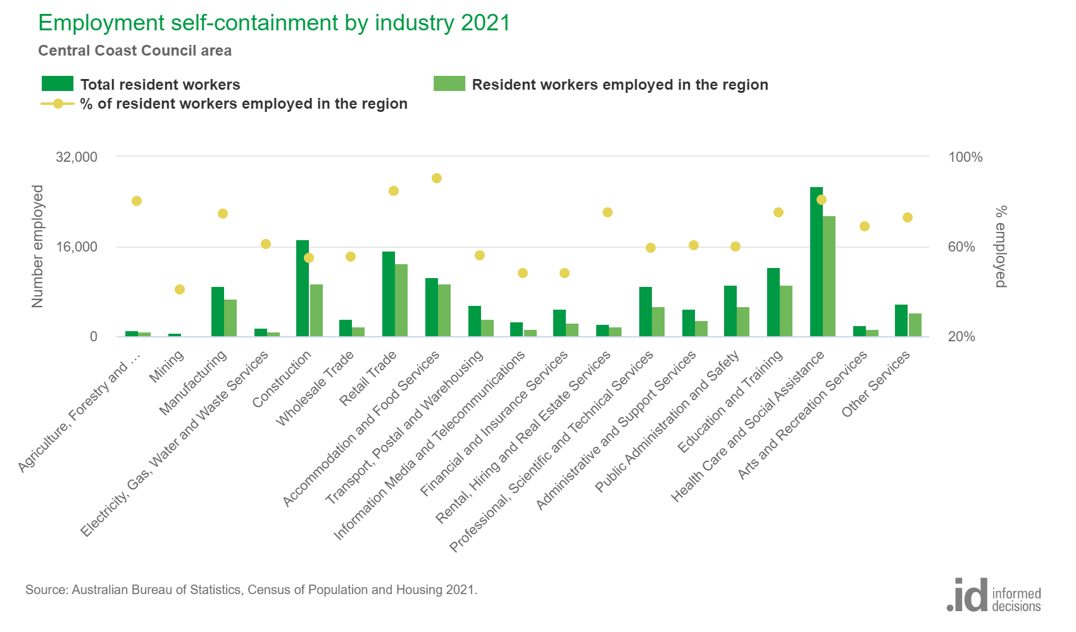
In the Central Coast LGA, the overall self containment figure is 70.1%, indicating that 7 out of every 10 Central Coast employed residents work in the local area. As illustrated in the chart below, self-containment varies by industry from a high of 90.3% for Accommodation and Food Services to a low of just 40.8% for Mining. Other industries with low self-containment include Information Media and Telecommunications and Financial and Insurance Services. These two sectors have a greater impact on commuting patterns than mining given their relative size.

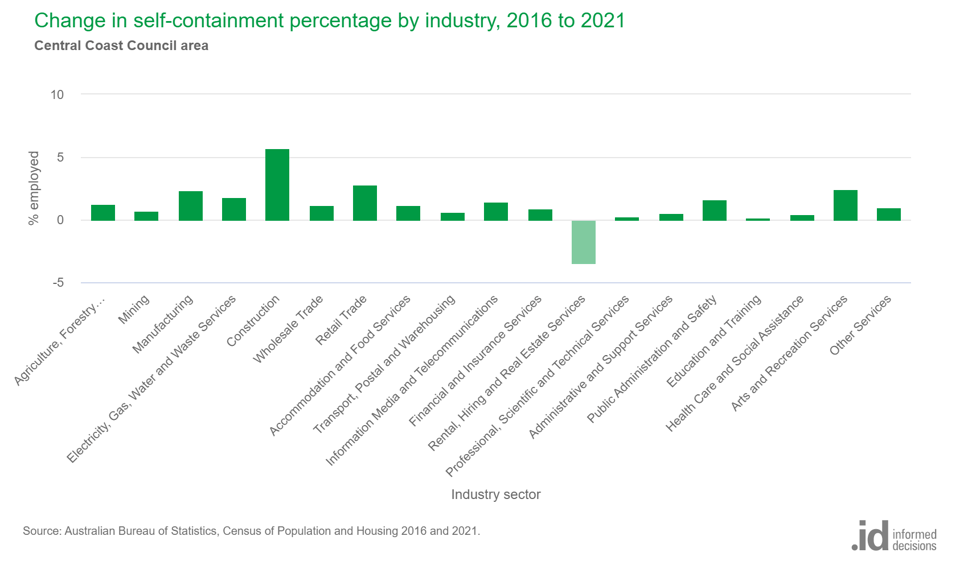
Self-containment improved between the 2021 and 2016 Census, which is pleasing as this reverses the downward trend between 2011 (73.2%) and 2016 (68.4%).
The big industry improvers were Construction (+5.7 pp), Retail Trade (+2.8 pp) and Manufacturing (+2.4 pp). Another positive sign was the improvement in business service industries which have historically had a low self-containment rate. For example, self containment in Information Media and Telecommunications increased by +1.5 pp and Financial and Insurance Services increased by 0.9 pp.

Using employment self-containment in economic development and strategic planning
Understanding employment self-containment at the industry level helps identify industry and skills gaps and roads and public transport infrastructure needs. This information can be used to:
- Prioritise economic development actions (e.g. investment / skill attraction)
- Advocate for infrastructure investment (e.g. public transport and roads)
- Support changes to employment zones (e.g. additional commercial zones)
- Support changes to housing policy (e.g. see this blog on affordable housing for local workers)
Of course, employment self-containment is only one piece of the local economic development puzzle. Other economic development questions which can be answered using economy.id include:
- How is the economy performing compared to benchmark areas?
- What is driving recent economic change in your area?
- What are your competitive industries, and how are they performing?
- Where are your key employment precincts / clusters and what is their industry mix?
- What is the socio-economic and skill profile of your workforce?
If you are from a council and want support answering these questions or a briefing / training session on the new Census 2021 information, please contact your client manager or email us at economics@id.com.au


