Are there enough local jobs for your residents?
Of the people who live in your area, how many work locally? As planners work toward 30-minute cities, new data (exclusive to economy.id) shows where longer daily commutes are on the rise.
Glenn explains the difference between self-sufficiency and self-containment, how to identify mismatches between local residents’ skills and job opportunities, and other data to form an evidence base for local economic development strategies.
We’ve recently completed a major update to our economy.id sites, addressing a question which gets to the heart of economic development;
“Are there enough local jobs for our residents?”
We have, for some time, had self-containment and self-sufficiency data online for 2016, but we had to remove the time series data, due to the ABS changing the way it collects the Census data.
We’ve previously written about the trap of comparing 2011 and 2016 employment data. In 2016, the ABS imputed a work destination for people who didn’t state one in the Census form, meaning that if you look at a comparison over time, worker numbers appear to have gone up simply because the ‘Not stated’ category doesn’t exist any more.
To address this problem, we’ve worked to source a comparable 2011 dataset with modelled imputed data from the ABS for some time. This week, we’ve just loaded the 2011 self-sufficiency and self-containment data as the last tranche of this update.
This is now live online for our FULL economy.id clients, meaning that economy.id is now the only place in Australia you can directly track your changing self-containment and self-sufficiency.
Where to find self-containment/self-sufficiency data for your local area

If your local council or regional authority subscribes to our economic profile, economy.id, you can now find local self-sufficiency and self-containment data under ‘resident workers’ menu.
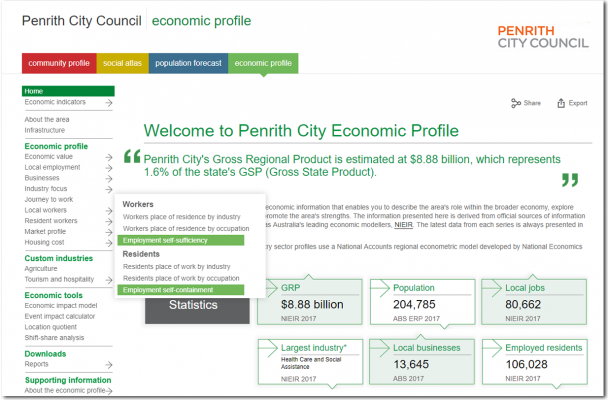
Example | Self-containment/self-sufficiency in the Penrith City Council LGA
Penrith is an outer suburban council on Sydney’s western edge. There are quite a few local industries, but more people commute out of the area, mainly along the train line to Parramatta and the Sydney CBD. At the same time, many of the workers in the area commute in from the nearby Blue Mountains.
Penrith has had strong population growth over the past few years. Between the 2011 and 2016 Censuses, it added over 17,000 people, or about 9% to the population, and continues to grow about 3,000 people per annum.
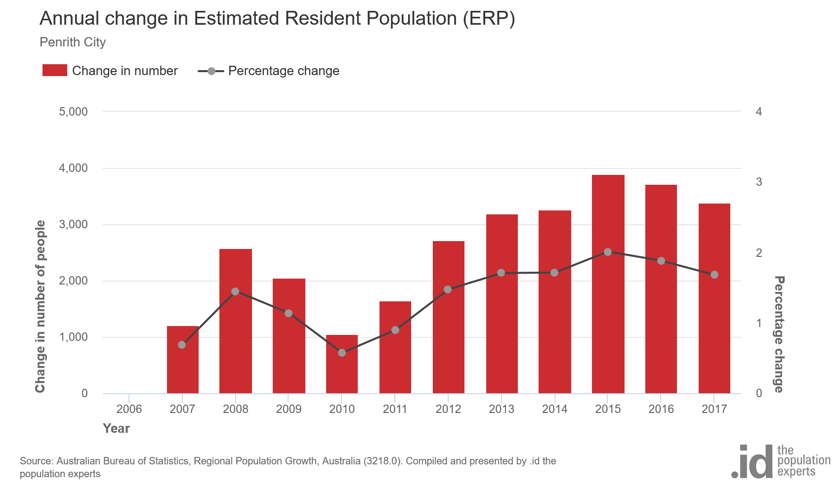
This presents a challenge for economic development – 17,000 new residents equate to roughly 11,000 employed people in 5 years.
Penrith’s self-containment page on economy.id shows that only 38.6% of the almost 95,000 employed residents worked in Penrith in 2016. This was a reduction from 40.4% in 2011, so a 1.8% drop.
While there was growth of over 8,000 jobs between 2011 and 2016(1), increasingly the new jobs are being filled by people from outside the area, while more locals are commuting out to work. This is a trend in many areas, but is particularly evident here in Penrith. The self-sufficiency also declined, from 55.8% to 53.5%, a fall of 2.3% in that time.
(1) Find this data for your area: open economy.id > Local employment > Employment by industry (total)
This is really useful information that helps Penrith target industries to support and develop in the area.
Two of the largest growth sectors are Health Care and Education – both having substantial educational requirements for entry, and these are less likely to be present in Penrith’s population, which generally has trades qualifications or no qualification(2).
(2) Find this data for your area: open economy.id > Local workers > Qualifications
Looking at the level of self-containment, it is highest for sales workers(3):
(3) Find this data for your area: open economy.id > Journey to work > Employment self-containment > type = occupation
But it fell the most for trades workers and labourers;
Find this data for your area: same steps as (3) above – just scroll down the page to see change over time
So blue-collar workers are now leaving the area to work more than they used to. To maintain local self-containment levels, Penrith would need to attract more industries with a Certificate-level workforce (difficult as industries such as Manufacturing are declining in most areas), or encourage greater education levels in the residential population, to fill the local jobs.
Looking at self-containment overall, it ranges from a high of 63.3% for Accommodation and Food Services (mostly cafes and fast food workers), to a low of 14.8% for finance and insurance workers (who mostly work in the City of Sydney).
Importantly, with the addition of the imputed 2011 data to economy.id, Local Government Areas like Penrith can track their self-containment and self-sufficiency over time.
Using the raw 2011 data, without the imputation adjustment applied, would have shown an apparent increase in self-containment, which was simply the result of using a different method to process the data in 2016. The new data that is now available in economy.id enables councils to make decisions based on the correct evidence.
Self-sufficiency and self-containment – a refresher
These are somewhat technical terms but what they represent is important!
Self-sufficiency
Self-sufficiency is the proportion of those who work in your Local Government Area who are local residents.
For instance, if there are 10,000 jobs in your LGA, and 6,000 of the people occupying those jobs are residents of the LGA, your self-sufficiency is 60%.
Self-sufficiency tends to be relatively low for inner city and jobs-rich areas where people commute a long way to work at that destination. It’s often quite high for outer suburban areas where there aren’t all that many local jobs, but those which are there are filled by locals. And it’s generally high for regional and remote areas where people all live and work in the same place (the exception being mining areas with fly-in/fly-out workers).
Who would be interested in looking at self-sufficiency?
Well, this is mainly of interest to those job-rich areas that may be looking at housing strategies (for example for key workers).
A declining self-sufficiency figure might mean that people are having to commute further to reach your area, and can’t afford to live locally. This is particularly important when looking at industry and occupations. For instance, an affluent area may have most professional workers living nearby, but sales and community workers mostly commuting from outside as they can’t afford to live there. Tracking this over time can look at how successful work on affordable housing has been, and whether this is improving.
Self-containment
Self-containment is the proportion of those who live in your Local Government Area, who also work in your Local Government Area.
In the example above, the 6,000 residents occupying jobs located in your area might be part of a pool of 20,000 local residents who are employed (anywhere). In that case, your self-containment is 30%. Self-containment tends to be high for areas with a lot of jobs, and low for outer suburban or “dormitory suburb” areas where most people leave to work elsewhere. As with self-sufficiency, regional and remote areas tend to be high for self-containment, as there’s nowhere else to go to work.
Who would be interested in looking at self-containment?
Self-containment is probably more widely used than self-sufficiency. Many economic development strategies have the goal of maximising the number of jobs available to local residents.
While not every resident will take up a local job, self-containment can show you just how many do. People working locally doesn’t just impact infrastructure but has environmental and social impacts as well. Fewer people commuting out means less pollution and greenhouse emissions, and more people with more time to spend with their families, so it’s generally a worthy goal.
The challenge in many cases (especially for outer suburban areas), is attracting enough jobs to offer local employment options for what is often a rapidly growing population. Tracking self-containment over time can help you see whether these goals are being met, or the area is falling behind in terms of jobs for residents.
How can I get this information in my area?
If you work with a council that doesn’t have access to economy.id, get in touch with our team here to register your interest in accessing this data in your area. Or, you can access economy.id for all subscribing councils in Australia here.
Glenn Capuano - Census Expert
Glenn is our resident Census expert. After ten years working at the ABS, Glenn's deep knowledge of the Census has been a crucial input in the development of our community profiles. These tools help everyday people uncover the rich and important stories about our communities that are often hidden deep in the Census data. Glenn is also our most prolific blogger - if you're reading this, you've just finished reading one of his blogs. Take a quick look at the front page of our blog and you'll no doubt find more of Glenn's latest work. As a client manager, Glenn travels the country giving sought-after briefings to councils and communities (these are also great opportunities for Glenn to tend to his rankings in Geolocation games such as Munzee and Geocaching).


.png)


