How is COVID-19 impacting population growth in our Capital Cities?
In this final of a three part series, Andrew Rossiter turns his attention to how COVID-19 is impacting population growth in different ‘types of places’ within our Capital cities.
Using the recent release of Annual Population Estimates from the Australian Bureau of Statistics (ABS), Andrew looks at how the first few months of COVID-19 impacted our Capital’s and what it means for our Local Government population forecast assumptions.
Also, don’t miss the opportunity to hear Andrew speak about these impacts at our free webinar. Watch it here.
Why are types of places in Capital cities important?
In our first blog, we looked at the impacts that the first few months of COVID-19 had on population growth in capital cities as a whole. We found that in the year to June 2020, overall growth in our capitals declined by over -56,000 new residents, or -20% compared to the previous year’s growth.
While on the surface this is a significant impact, we know that it is not the same for all places within our capitals.
To help us better understand the nature of these impacts, we use our typology framework which defines Capital city council areas as either:
- CBD areas that provide a range of capital city functions to a wide metropolitan area.
- Inner city areas that immediately surround CBD areas.
- Suburban areas which are the residential areas of our capital cities.
- Growth areas which are outer metropolitan areas experiencing population growth.
To see which Council areas are included under each typology, click the orange link above to read the original blog.
And how is population growth being affected?
Capital cities are the population and economic growth centres of Australia, contributing over 80% to both population and job growth. So, let’s take a closer look at how this growth is being impacted…
CBD and Inner city areas
The first few months of COVID-19 impacted population growth in CBD and inner city areas more than any other type of place in Australia.
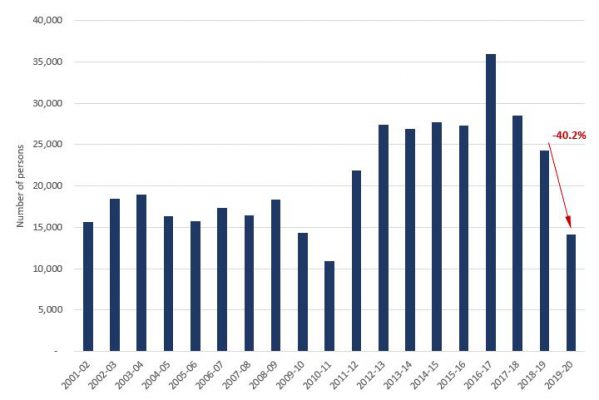
In the year to June 2020, CBD areas experienced a decline in growth of over -10,000 residents. That’s a decline of -42%, compared to the previous year! In a similar vein, inner city areas experienced a -47% decline in growth.
The City of Melbourne (-45%), Sydney (-52%) and Parramatta (-47%), were the most heavily impacted CBD areas. While the City of Adelaide (-15%) and Perth (which actually experienced +72% in growth), proved more resilient.
Annual Change in Estimated Resident Population, (No.), CBD areas, 2001-02 to 2019-20
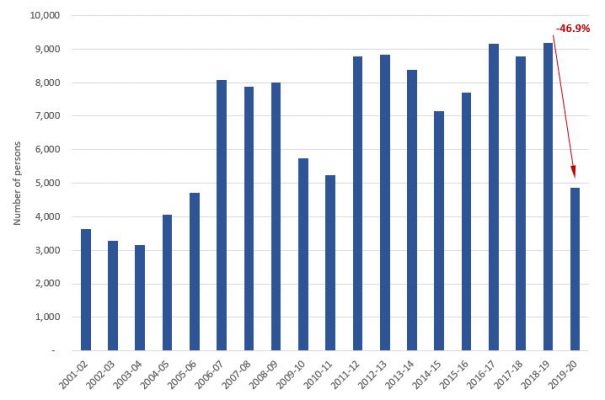
The inner city areas most heavily impacted include the City of Port Phillip ( -64%) and Yarra (-46%) in Melbourne, and Inner West Council (-60%) in Sydney. Again, inner city areas in Perth remained resilient with the City of Subiaco (+1%) and the City of Vincent (+18%) both experiencing increases in growth.
Annual Change in Estimated Resident Population, (No.), Inner city areas, 2001-02 to 2019-20
Suburban areas
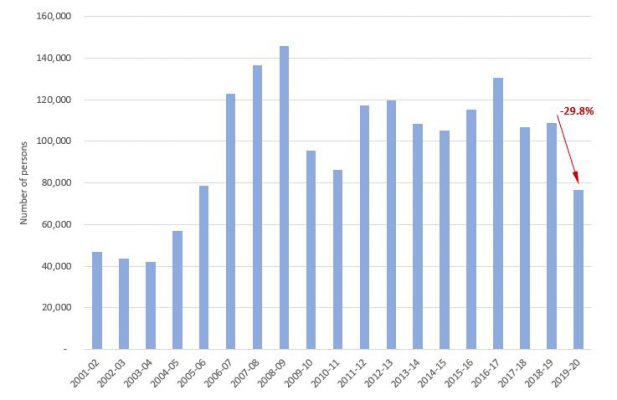
Suburban areas experienced an overall decline in growth of -30% in 2019-20, compared to the previous year. While this is less of a decline in relative terms (%) compared to CBD and Inner city areas, the actual decline in number of new residents (-32,000) was greater, which makes sense, as collectively suburban areas are the primary residential areas in our capitals.
Just under two-thirds of suburban council areas experienced a decline in the level of growth compared to the previous year.
But what I find interesting is that all but two of the 28 suburban council areas that experienced an increase in the level of growth, were either located in Perth or Adelaide. So again, Perth and Adelaide were more resilient than their larger eastern counterparts.
Annual Change in Estimated Resident Population, (No.), Suburban areas, 2001-02 to 2019-20
Growth areas
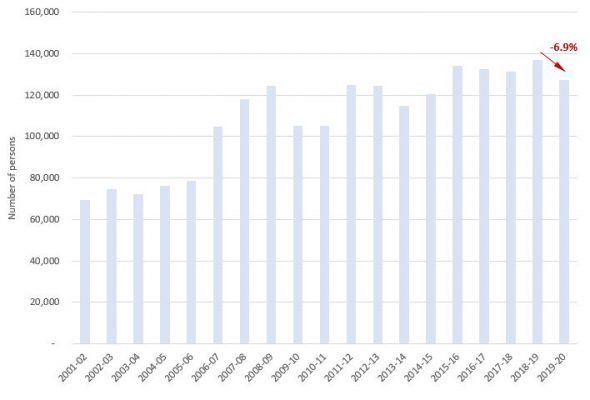
Growth areas continued recent rapid levels of population growth, increasing by 127,000 residents in 2019-20. This was a -7% decline compared to the previous year (which was actually the largest increase on record).
While still experiencing very strong growth, the growth areas that were more negatively impacted tended to be in Melbourne and coming off the back of rapid growth in the previous year.
On the other hand, the largest relative increases were in the more affordable areas of Perth and Adelaide which came off slower growth in the previous year, including the City of Gosnells (+86%), Cockburn (+31%), Mandurah (+30%), Swan (+21%) and Playford (+19%).
Annual Change in Estimated Resident Population, (No.), Growth areas, 2001-02 to 2019-20
And, it’s migration that is driving the change!
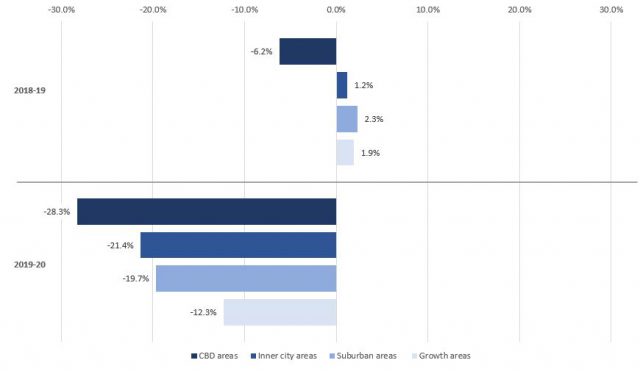
The impact of national border closures reduced net overseas migration to 194,000 new residents in the year to June 2020. A decline of -45,000 residents, or -19% compared to 2019.
This was felt most in CBD areas (-28%), which are historically the first port-of-call for many new residents arriving from overseas, including large numbers of international students. Inner city areas (-21%) and suburban areas (-19%) also experienced large relative declines.
Growth areas (-12%) were more resilient to the initial overseas migration shock. Typically large numbers of overseas born residents move to growth areas after already having lived elsewhere in our cities, so while growth areas are impacted less by the initial shock, they may be facing more challenging times ahead.
Change in Net Overseas Migration (%), Capital cities, 2018-19 to 2019-20
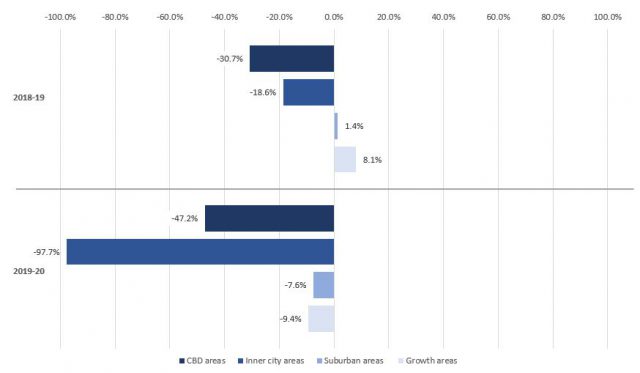
In overall terms, the initial impacts of COVID-19 on people moving WITHIN Australian (ie internal migration) was severe. Basically, in the three months to June 2020, far fewer people moved house.
This impacted CBD and inner city areas heavily, which attracted far fewer young adults from other parts of Australia than they otherwise would. CBD areas experienced a -47% decline in internal migration, while inner city areas experienced a -98% decline!
What is also interesting is that internal migration reversed in Perth and Adelaide, with the both capitals experiencing growth in net terms. Again, this net growth was primarily driven by far fewer people moving to the eastern states, a major factor contributing to the resilience experienced in both capitals.
Change in Net Internal Migration (%), Capital cities, 2018-19 to 2019-20
So what does this information mean for my local area population forecast?
Over the past year our Local Government population forecasting team have been sharing our thinking, learnings and hearing from clients how COVID-19 is impacting small area population forecasts. This has got us to a point where we feel we can provide an indication of the ‘most likely future’ of population outcomes even in the current highly uncertain times.
The release of the ERP is another useful source of information which continues to give us confidence that our assumptions are broadly reflective of the (continually) evolving situation; as well as assurance that the forecasts for many of our Local Government clients are tracking well.
Our forecast.id newsletter provides you with regular updates on our thinking in this space; get in touch to be added to the mailing list!
Want to know more?
Register here for our 30 minute lunchtime webinar on June 9th, where my colleague Katie Bayley and I will share what we have learnt about how COVID is shaping population growth in your local area.
Andrew Rossiter
Andrew’s background is in urban economics with a focus on urban productivity, regeneration, and strategic land-use planning. Andrew works together with our local government clients to develop and monitor population forecasts, and is currently developing forecast.id’s monitoring process. His background in consulting and economics has developed his ability to draw out the policy implications of population forecasts, and understand and communicate the macro influences on demographic change.