Federal Government’s “HomeBuilder” scheme – where will the money go?
Glenn provides some context for today’s announcement of the Federal Government’s Homebuilder scheme: What contribution does construction, especially residential construction, make to the Australian economy? What portion of that is from renovations? And which areas are likely to benefit the most from this stimulus?
On Thursday, June 4th, the Australian government announced a new stimulus package to assist the construction sector in the COVID-19 crisis.
The scheme, called “HomeBuilder” is expected to cost $688 million in grants to homeowners who are doing renovation between now and the end of 2020. The grants would be for $25,000 but they only apply for homeowners doing works valued at more than $150,000 on properties worth less than $1.5 million.
What contribution does construction make to the Australian economy?
So what does that stimulus look like in the context of the construction activity we’ve seen over the past few years?
Construction is an important part of the economy. In 2018/19, it made up 8.7% of Australia’s total value-added, approximately $136 billion. This varies a lot from place to place. Growing outer suburban areas and city centres tend to have a higher share of their economy in construction. For instance, Camden, NSW has 29.1% of its economy in Construction. Open the economic profile for your area to see your local economy’s reliance on construction.
Building work approved is the major input to the construction sector, and is a major economic and social indicator. For this reason, we have building approvals on both our economic profiles and community profiles in the .id toolkit. These are updated monthly.
In the 12 months to April 2020, the total amount of building approved for construction in Australia was $117.7 billion.
Of this, a little over half ($65.9 billion) was residential construction. The vast majority of this residential amount was in the construction of new dwellings. Only $8.4 billion, or around 13% was in the “Alterations and additions” category, which includes renovation.Since the stimulus is costed at $688 million, over approximately 7 months, and at most will kick in one-sixth ($25k/$150k) of a renovation, this indicates that the government is expecting to provide this funding around 80% of the renovations which could expect to be approved by the end of the year, if this year mirrored last year. Or (and they are probably hoping this, as it’s what you want with a stimulus) a significant increase in renovations in response to the subsidy.
5 years ago, I blogged about Victoria being Australia’s renovation capital, with just under $2.4 billion of alterations and additions in a financial year. Here is an update on that, for the year ended April 2020.
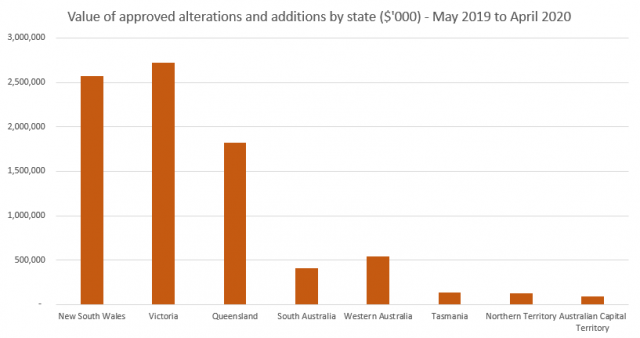
Source: ABS 8731.0 Building Approvals, Australia, generated from ABS.Stat
So Victoria remains the renovation capital, with about $2.7 billion worth in the past year. But on a per-capita basis (adjusted for population size at September 2019), the Northern Territory is actually a little higher, with $527 spent for every person resident in the NT.
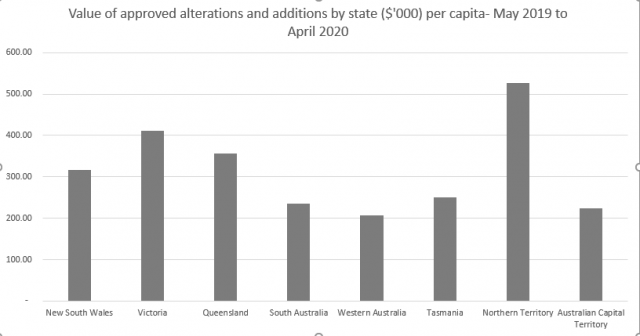
Source: ABS 8731.0 Building Approvals, Australia, and Australian Demographic Statistics, 3101.0
So is construction in decline?
Early indications are that construction was slowing in April, but as many projects are already in the pipeline, the slowdown takes a while to take effect. Our economics team are expecting to see significantly lower construction figure over the next quarter. Clearly, so is the government, hence these sort of stimulus packages are pre-empting what is expected to happen.
April’s national figures for overall building are $8.7 billion, down from $9.2 billion in March. But quite a bit of that drop off is in the renovations category, which fell from $770 million to $606 million in a month. That’s a fall of 22%, but month to month figures do tend to jump around a bit at the best of times.
What it shows is that the government’s targeted stimulus may be in the right area of the construction sector – if it’s renovations and additions that are falling off first in the current uncertain environment, this may encourage more people to take on these projects and therefore support the sector. Who knows, maybe in lockdown, everyone is doing their own renovations rather than getting the construction industry in to do it!
These are big projects that we’re talking about though, so they may be beyond the capacity of most people to DIY. The stimulus would account for only about 0.6% of total construction expenditure in the last year, but around 8% of total expenditure on alterations and additions.
What exactly can you get for a $150,000 renovation?
Based on the estimates on this commercial trades directory I found online (not being an expert in the renovation, home or otherwise, and I haven’t vetted these figures!) that would buy between a 50sqm and 100sqm extension, depending on whether it was ground level or an extension upwards. I guess that’s something like a new living area and 2-3 new bedrooms – it’s not just sprucing up a kitchen or bathroom or doing a bit of backyard landscaping.
Who is this package designed to support?
This is very clearly government support for the industry though, not targeted at lower-income or disadvantaged groups. Those most likely to take advantage of a subsidy for large renovation projects are most likely in the more affluent areas of our cities. Just a glance at the top 10 broad regions for renovation $ in the last year shows that the greatest proportions are done in well-off areas close to our largest cities.
It seems unlikely that a $25,000 subsidy on a minimum $150,000 renovation would encourage large numbers of people in lower-income areas to decide to renovate. There is even a question about whether it would encourage more of those more affluent homeowners to renovate either – or will it just help pay for those who would have renovated anyway?
Top 10 SA3 regions for renovation value done in the 12 months to April 2020
Source: ABS 8731.0 Building Approvals, Australia, generated from ABS.Stat
In contrast, the lowest level of renovations, are in sparsely populated areas like outback Western Australia. Also some growth areas on the fringe of our metropolitan centres, places like Brighton, Tasmania, and Beenleigh, Queensland, both of which have under $4 million worth of renovations for the year. Not only are these areas much lower socio-economically, they also would have a higher proportion of new build houses, so less older stock to renovate.
Of course, the stats only show building work which requires approval and is valued at $10,000 or more. It’s likely that a lot of smaller residential work doesn’t require approval and doesn’t make it into these numbers, so it can’t be seen as the complete value of the renovation industry, but it’s a fair approximation.
Where can I see building approvals data for my area?
Building Approvals are such an important indicator of both social and economic characteristics of an area, that we actually include them in three different .id products, as well as a lot of our consulting work.
Our community profiles (profile.id) have the number of new dwellings approved (not renovations) on a financial year basis, but updated monthly.
Our economic profiles (economy.id), have the value of building approved across all sectors, broken down into residential and non-residential, updated monthly.
Our housing monitor (housing.id), has the most detailed building approvals data available – by type of building, and location within your area by SA1, updated quarterly. It also tracks completion of dwellings compared to the time of approval.
Glenn Capuano - Census Expert
Glenn is our resident Census expert. After ten years working at the ABS, Glenn's deep knowledge of the Census has been a crucial input in the development of our community profiles. These tools help everyday people uncover the rich and important stories about our communities that are often hidden deep in the Census data. Glenn is also our most prolific blogger - if you're reading this, you've just finished reading one of his blogs. Take a quick look at the front page of our blog and you'll no doubt find more of Glenn's latest work. As a client manager, Glenn travels the country giving sought-after briefings to councils and communities (these are also great opportunities for Glenn to tend to his rankings in Geolocation games such as Munzee and Geocaching).