Following her previous blog about housing stress, a number of people contacted Georgia wanting to know where housing stress was playing out at more of a local level. We’re only looking at New South Wales and Victoria here (our fastest growing states), but it demonstrates the strong spatial patterns associated with housing stress.
Our focus on housing
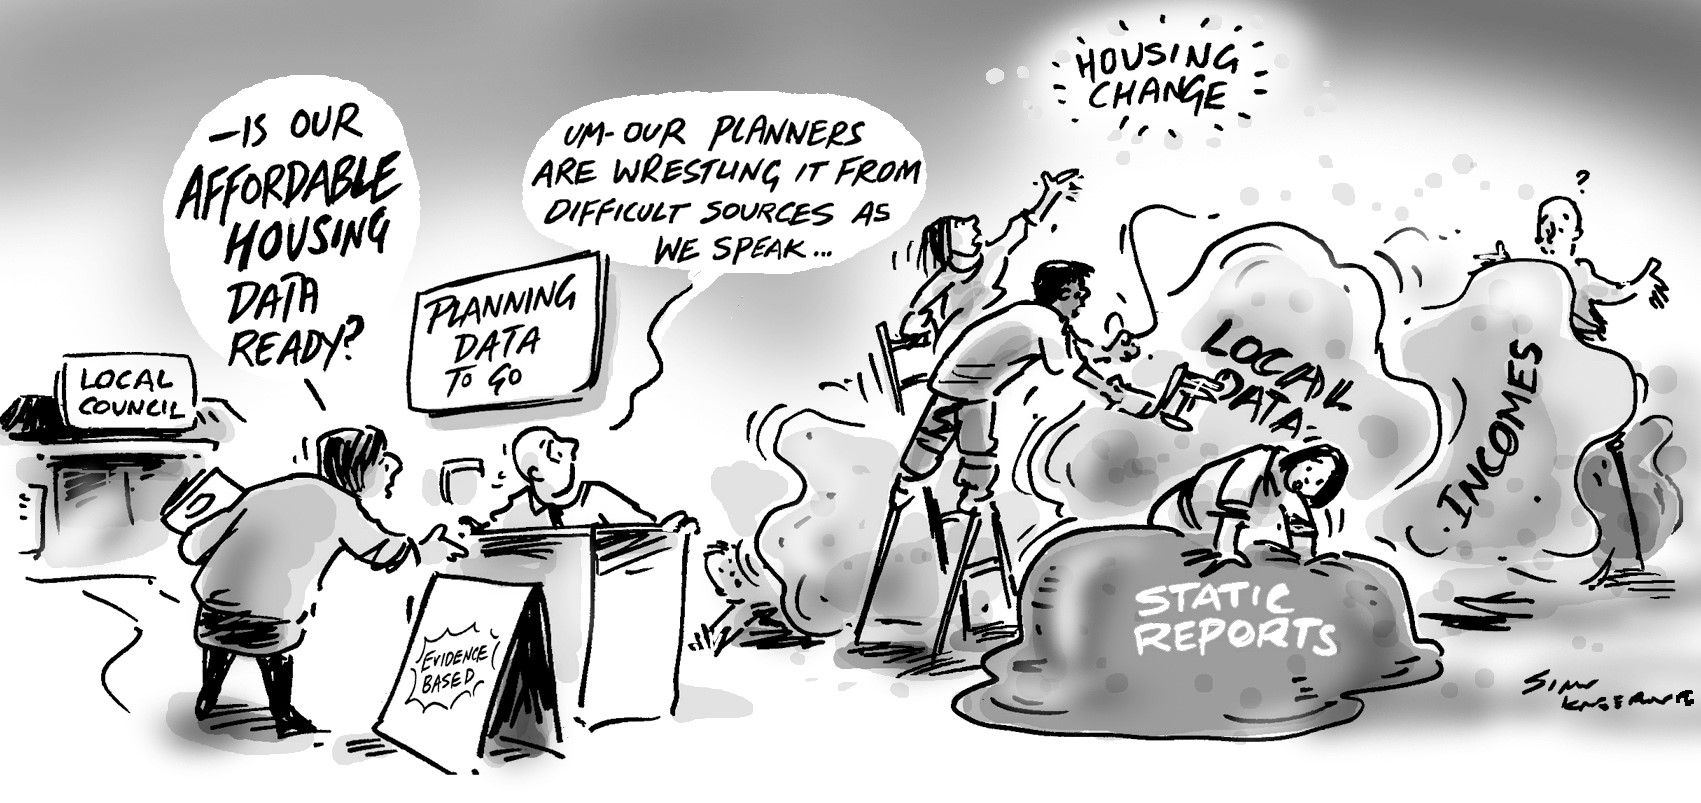
If it feels like we’re writing about housing a lot at the moment, you’re right – we are! I’m part of a new team at .id who are focused on helping local governments understand the housing implications of their local demographic profile. Much of what we’re writing about arises from what we’re learning as we continue to build out the capabilities of our new online tool, housing.id.
If you’re involved with housing policy or planning, we’d love to show you the tool, and how we can support your council to plan for affordable and appropriate housing supply in your area. Book a time to chat with us here.
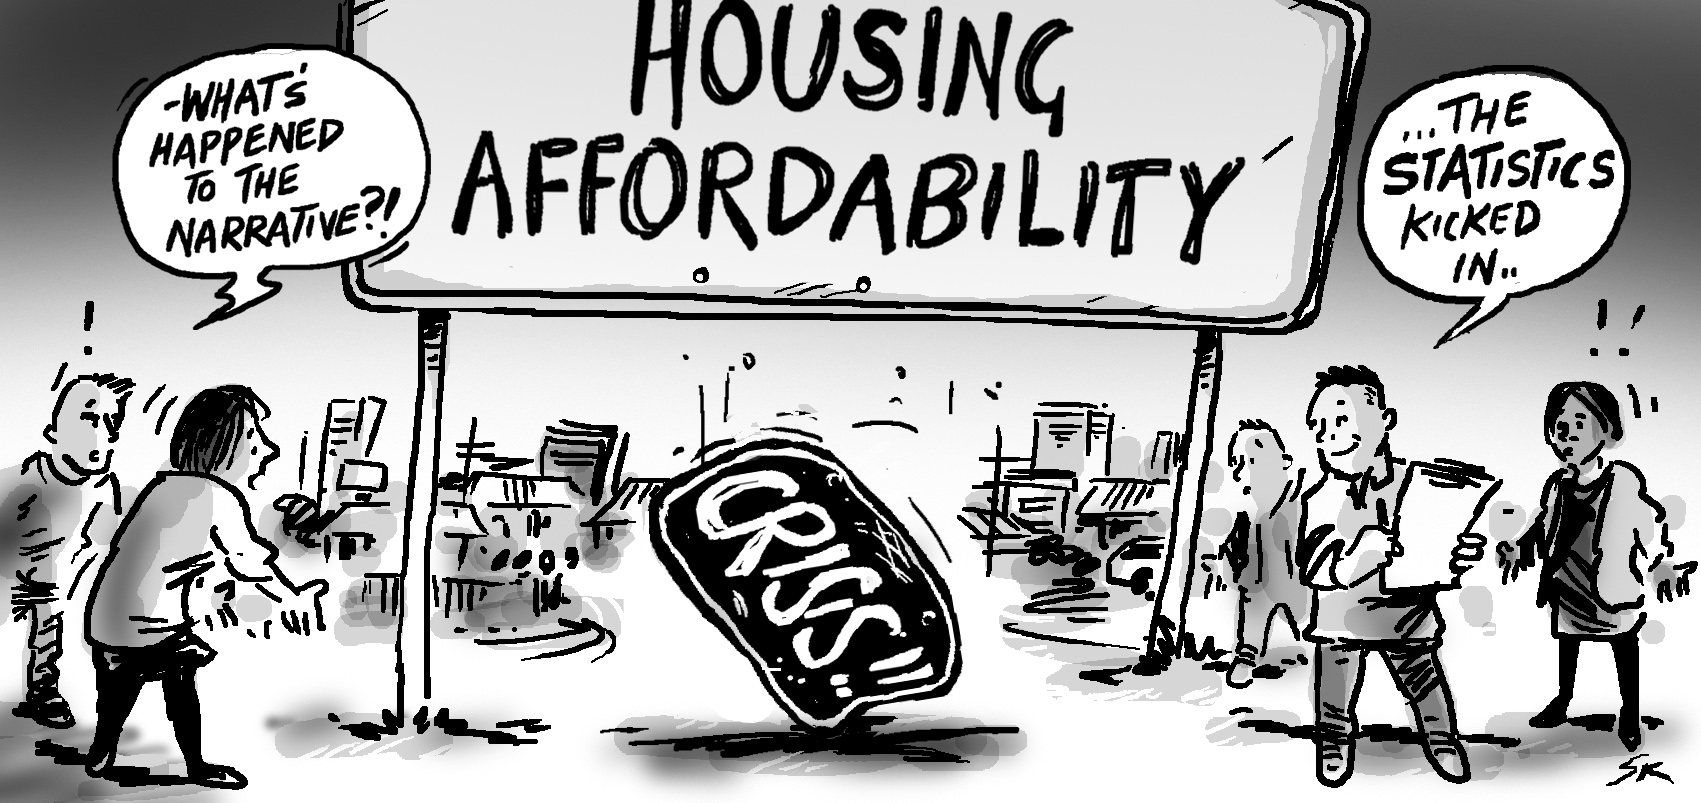
Questions after our last blog
Following my last blog about housing stress (and the changes to how it’s calculated in some areas) -I received questions from a number of people who wanted to know exactly where, in our fastest growing capital cities, housing stress was being felt the most.
I’ve put together some data we have available from our work building housing.id. We’ve also expanded our analysis to the regional areas of NSW and Victoria, as there are some interesting trends to discuss in these areas.
Which LGAs in New South Wales are experiencing the highest levels of housing stress?
In NSW, the highest rates of housing stress are, unsurprisingly, found in Greater Sydney. The LGAs in which it is felt the most include Fairfield (23.8%), Cumberland (23.5%) and Canterbury-Bankstown (23.1%). These areas have high proportions of low-income earners and have seen a significant increase in the number of rental households since 2011.
The LGA with the lowest rate of housing stress, Ku-ring-gai (8.9%), has also seen an increase in renting, but this is countered by a high proportion of high-income earners and households that fully own their home.
In regional NSW, the highest rates of housing stress are found on the North Coast, in Byron (16.6%), Lismore (16.1%) and Coffs Harbour (15.8%). Housing stress in these areas is likely to be driven by high proportions of low-income households, but also increasing housing costs in turn driven by higher income residents moving into the area.
An interesting trend that can be seen on the map is that many of the regional, coastal areas of NSW have reasonably high rates of housing stress, but these rates decrease as you move inland. Other areas with higher rates include inland regional centres, such as Armidale, Albury and Bathurst.
Which LGAs in Victoria are experiencing the highest levels of housing stress?
Following the same trend as NSW, the highest rates of housing stress in Victoria are found in Greater Melbourne. The LGAs in which it is felt the most include Melbourne (30.1%), Greater Dandenong (19.4%) and Hume (19%). Again, these areas have high proportions of low-income households, which, in Melbourne’s case, is driven by a large number of university students.
The lowest rate in Greater Melbourne is found in Nillumbik (8.5%), which, like Ku-ring-gai in Greater Sydney, is influenced by a high proportion of high-income earners and households that fully own their home.
In regional Victoria, the highest rates of housing stress are found in Bass Coast (14.1%), Ballarat (13.9%) and Wodonga (13.1%). There are significant proportions of low-income households in these areas, and this proportion has increased in all three LGAs since 2011.
The lowest rates of housing stress are found in north-west Victoria, in LGAs such as West Wimmera (4%), Hindmarsh (4.7%) and Buloke (5%). These areas also have high proportions of low-income households, but over half of all households in these areas fully own their home, and for others who still have housing costs, rents and mortgage payments are very low.
Get housing.id in your area
We’ve worked with a number of local councils to create housing.id as a simple, web-based resource that combines the demographic, economic, housing and population forecast data we know councils need when planning for future housing in their local government area.
If you’re working on a strategic plan or housing strategy for your council, book a time to speak with us about housing.id here.
Or, contact us here and tell us what you’re working on!