How to measure housing stress in your local government area
Georgia Allan shares some work we’ve done with the ABS in response to a recent change to the definition of ‘housing stress’ in some parts of Australia. This change enables our local government partners to measure how many households, in different income brackets, are experiencing housing stress.
Do you work in local government?
Learn more about the work we do with local government housing teams or email us about an evidence base for your affordable housing strategy or advocacy work.
Housing affordability in the news this week
This week, Anglicare Australia released their annual Rental affordability snapshot. This year’s report points to a ‘crisis for the poorest’ – of the 69,000 rental listings reviewed for the report, only a 317 were affordable for people on the disability support pension, 75 to single parents with one child on Newstart, and none for single person on youth allowance in our biggest capital cities.
The role of Local Government
Interestingly, the report calls for the State and Federal governments to act, but it doesn’t mention the important role local government plays in addressing the issue of affordable housing.
Working closely as we do with councils across Australia, this is a problem that also lands squarely at the feet of local planning and advocacy teams;
1. Councils advocate to state government for the housing needs of their community
2. Strategic planning teams need to balance the provision of affordable housing with other community considerations
Taking a wider view of the at-risk population
While the Anglicare report does important work drawing attention to some of the most vulnerable in our community, local planners and community services teams need to take a wider view of the problem. They need to not only understand any mismatch between supply and demand, but also measure housing stress.
How local governments measure housing stress
The Housing stress indicator identifies households that are struggling financially to meet their housing costs.
Most research bodies, State Governments and Councils used a definition produced by the National Centre for Social and Economic Modelling (NATSEM).
NATSEM defines housing stress as households in the lowest 40% of incomes who are paying more than 30% of their usual gross weekly income on housing costs.
A new definition of housing stress
However, a new definition has recently been introduced in New South Wales and Victoria, and we suspect it will travel to other states and territories soon enough.
The NSW and Victorian Governments have developed new income brackets to assess the number of households experiencing housing stress. These new income brackets will replace NATSEM’s ‘bottom 40% of incomes’ definition.
In these states, a household is considered to be in housing stress if they are in one of the following household income brackets and spending more than 30% of your gross weekly income on housing costs.
As this new calculation is relative to the median income in a given area, the brackets change from place-to-place.
So, taking Greater Melbourne as an example, the following households would be considered to be in housing stress if they were spending more than 30% on housing.
Aligning household incomes with housing stress brackets
The problem, then, is aligning these income brackets with the housing stress brackets that are included in the new definition of housing stress (which varies from place to place).
Why is this an issue?
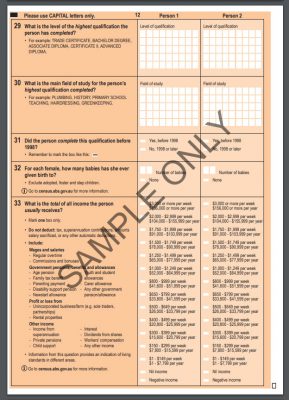
Individual income (and therefore household income) data is collected in the Census by income brackets, not specific dollar amounts.
You may remember completing this page on the last Census..
As you can see from the table below, these income brackets do not align well to the new housing stress brackets prescribed by the State Governments;
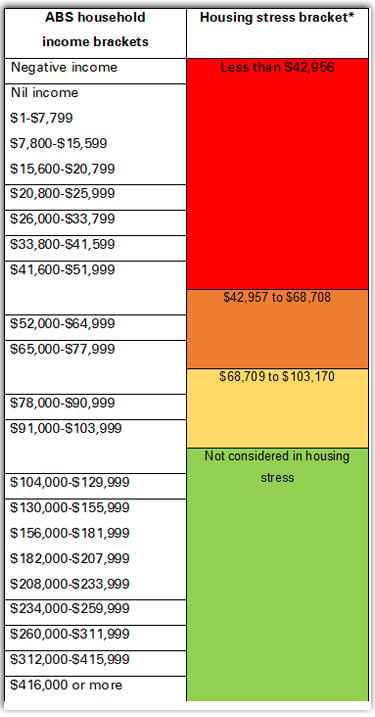
*For this example, we’ve used the housing stress brackets as they would be calculated for Greater Melbourne. These brackets would be different in another area with a different median income.
Remember, the amounts that define these housing stress brackets changes from place to place. This is particularly apparent in Regional Victoria, where the cut off for being classified as Very Low income is $29,864, which falls within the $26,000-$33,799 range.
How we make this work for housing.id
Where a housing stress bracket ‘splits’ a household income bracket, we needed to find a way to apportion these households into the appropriate housing stress bracket for our housing.id product.
Still with us?
We’ve worked with the ABS to come up with a way to do this.
Using income data collected from the Survey of Income and Housing, which is collected as specific dollar amounts, the ABS can determine the average income within each of the individual income brackets.
These individual incomes are then used to understand the distribution of household incomes within each household income bracket, so we can more accurately apportion them into the appropriate housing stress bracket.
So what does the data tell us?
The results – housing stress in Sydney and Melbourne
Looking at this data from the ABS, we see a broader picture of housing affordability in the cities that have seen the most population growth in recent years – Greater Sydney and Greater Melbourne.
(A reminder, this data is available at the local government area, for subscribing councils, in housing.id – but here’s a sneak peak at what the data is saying for Greater Melbourne and Greater Sydney).
As shown in the chart below, housing stress plays out a little differently in Greater Melbourne and Greater Sydney.
Mortgage stress is higher in Greater Melbourne (21.1% compared to 17.5%), however rental stress is higher in Greater Sydney (37.5% compared to 35.6%).

If we take a closer look at rental stress, breaking it down by the new income brackets, you can see significant differences between Greater Melbourne and Greater Sydney.
In Melbourne, the proportion of renters in stress decreases as you move up the income brackets. However, in Sydney, there are very similar proportion of very-low-income and low-income renters in stress.
Also, the rate of moderate-income renters in stress is double that of Greater Melbourne’s.

Why is this only available for Sydney and Melbourne?
If you’re wondering why we haven’t included other capital cities in this analysis, Victorian and New South Wales are the only states that have adopted the new definition of housing stress.
As always, our interest is at the local level. While these state-level stories are important, we know the story changes significantly from LGA-to-LGA. That’s why we’ve developed this methodology to enable local councils across Australia to tell the story for their area.
This and other housing data for your local government area
If you’re in local government and would like to understand the story in your area, book a time to speak with our housing team here.
Georgia Allan
Georgia completed a Masters in Population Studies and Demography at Flinders University in Adelaide. At .id, Georgia is a consultant in .id's housing team. She was heavily involved in the creation and continued development of housing.id, the online tool developed to give councils an accessible evidence base for planning and advocacy. Georgia has prepared housing demand and supply analysis for a range of councils, including those in inner-city, middle ring, growth and peri-urban areas. When not in the office, she is likely to be cooking, knitting, crocheting, or buried in a good book.