A new module in our community profiles makes it possible to compare the demographic characteristics of women and men in your area. Glenn shares some of the insights on offer from this new feature that evolved out of a piece of demographic consulting we recently completed for the City of Parramatta.
Late last year, the City of Parramatta approached us wanting to understand the state of gender equity in their Local Government Area. The resulting report would be used to inform policy development to address gender inequality by better understanding education and graduate outcomes, income and pay gaps, caring responsibilities and other areas of relative disadvantage.
The data required to tell this story is a classic ‘cross tabulation’ that examines the demographic characteristics of a particular subset of the population. In our community profiles, we call these cross-tabulations Communities of Interest (COIs), other examples of which we’ve written about previously.
This new Sexes COI module is now available as an optional module that can be added to the community profile for any subscribing council or authority (if you work at a subscribing council, you can request the module be added to your profile here).
What does the new Sexes COI module tell us?
Jump ahead to the detailed analysis of Gender equity in the City of Parramatta.
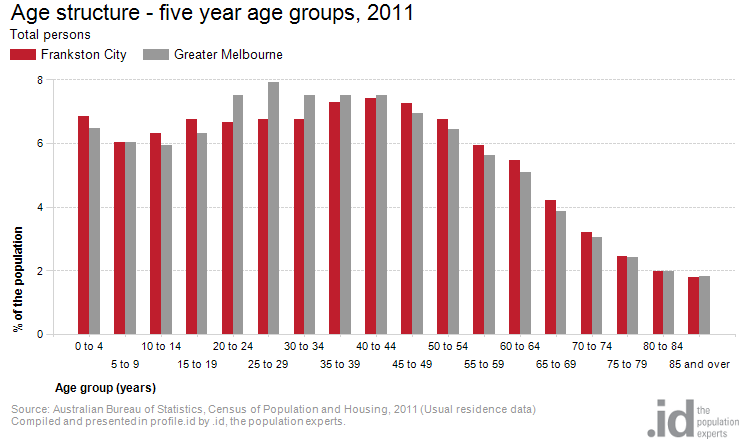
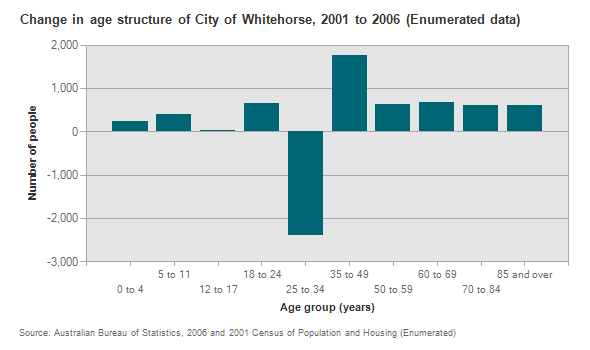
We have always had Males and Females information on our community profiles (for example, looking at the age structure of a population, broken down by sex).
This new Sexes Community of Interest, however, allows direct comparison between Males and Females for a much wider set of characteristics. You can compare (benchmark) either sex to the other, or to the same sex in the wider region (eg. Females across Australia). And, importantly, there is data for multiple Census periods so you can tell a story of change over time.
Where do I find the Sexes COI module?
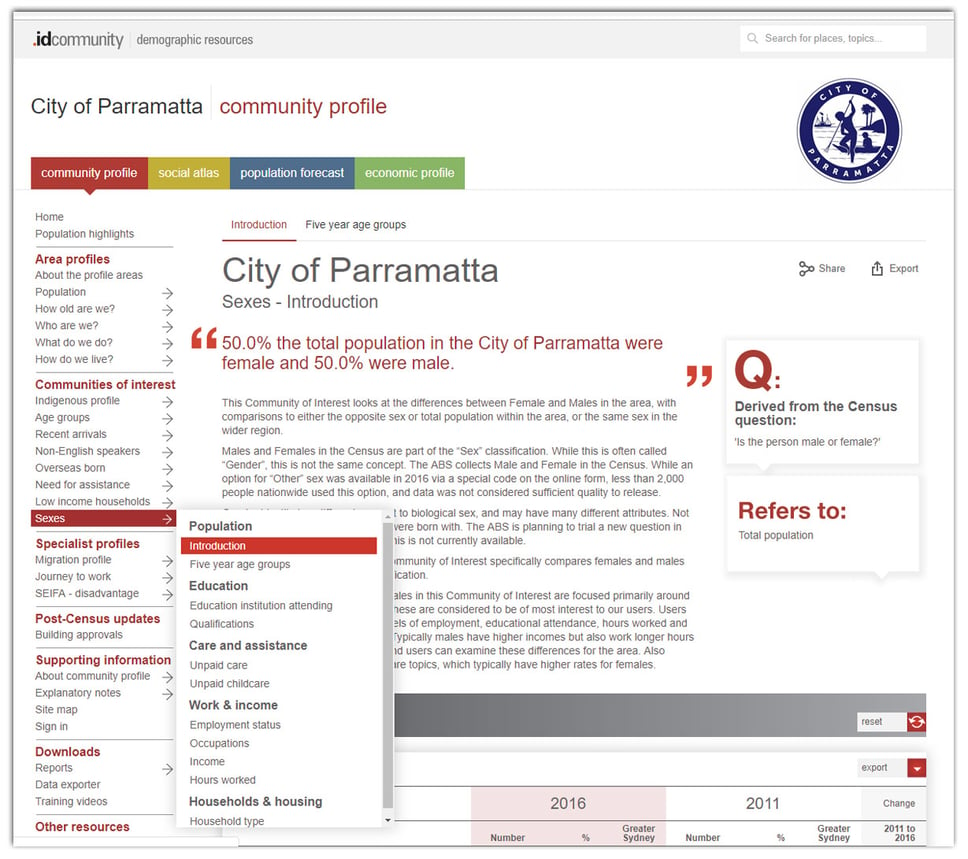
Have a look at this new module on the City of Parramatta profile.id page, where it appears under the “Communities of Interest” heading.

The topics included have been selected to show the main differences between females and males.
Why ‘Sex’ and not ‘Gender’?
The correct term for what is assessed in the Census is “Sex”.
The ABS is looking at a new question for 2021 that would cover gender identity in more detail, but what is available from previous Censuses is strictly Sex – Male or Female only. An option for “Other” was included in 2016 but less than 2,000 people nationwide opted for it, and it was only available via requesting a code on the online form, so many people may have been unaware of it.
The gender equity story in Parramatta
Differences in age structures
For instance, females are generally a little older than males, due to longer life expectancy (life expectancy at birth for females is 84.6 and males 80.5, so women live on average 4 years longer).

Differences in education
The site also shows that (in Parramatta at least) females are more likely to have a degree qualification or diploma, while males are more likely to have a vocational qualification. Interestingly, female qualifications are increasing at a faster rate than males, perhaps not surprising given the increase in female university attendance in 5 years.
Differences in unpaid work
Unpaid work disproportionately falls to women, who are 50% more likely to provide care to an aged or disabled person than males (but less likely than females across Greater Sydney), and 32% of women compared to 24% of men provided unpaid childcare.
Differences in paid work
But men still do the largest proportion of paid work, with a workforce participation rate of 68% in Parramatta compared to 56% for women. Interestingly, males in Parramatta were slightly more likely to be in the labour force and females slightly less likely than across Greater Sydney.
Detailed findings for Parramatta
While the Community of Interest on the website is great, we also used this for a more detailed consultancy for Parramatta. They had an interest in examining the status of women in the area more broadly, and whether or not there is gender equality in the area, opportunities in the labour market etc.
So the consultancy was able to look more closely at things like:
- Fields of study and opportunity for women in universities. This showed that females are still over-represented in courses that mainly lead to lower pay and part-time work.
- In which areas in the LGA women were doing the most caring for children and where there might be a need for childcare provision.
- A break down of childcare and unpaid care by age groups.
- Comparison of caring responsibilities and labour force status to see at what age women returned to the workforce after having children. This showed significant differences and possible barriers to returning to the workforce in Parramatta, more so than is found nationally.
- Volunteering rates among males and females.
- The rate of single parent families by area and differences between the sexes here (80% of single parent families nationwide have a female parent).
- Gender pay gap-analysis of incomes by occupation and by full-part time work to look at the actual difference in income between the sexes.
The gender pay gap in Parramatta
This last point is interesting. The Sexes community of interest does show income between males and females:

This clearly shows that women have a lower income than men on an individual level, but it doesn’t constitute a gender (or sex) pay gap. Women work less paid hours on average, and there are less in the labour force due to childcare responsibilities etc.

The consultancy was able to take this a bit further by restricting to the employed population, and controlling for occupations and hours worked, getting closer to an hourly rate of pay gender gap.
This revealed a gender pay gap in Greater Sydney of approximately 1.2% for part-time workers and 6.1% for full-time workers – when adjusted to an hourly rate. For Parramatta, the gap was actually a little lower, and very marginal for part-time workers.
The analysis also showed the largest pay gap of 26% for Managers, while Clerical and Administrative Workers had a pay gap of only 2%. This still doesn’t account for specific roles within these occupation groups or the role of choice of career but does give an indication of where any remaining gender inequality in the workplace may lie.
Adding the new Sexes COI on your community profile
If you work at a subscribing council and would like this new module added to your community profile, get in touch with our team here (please note, there is a fee associated with adding this module).


