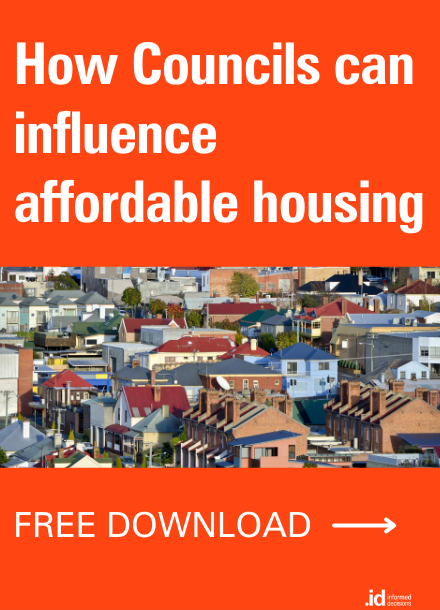
Is housing in Australia unaffordable? Results from a recent survey conducted by the ABS show that at a national level, we still have about 2/3rds home owners, and most are not in housing stress.
The ABS released the results of their biennial survey, “Housing Occupancy and Costs“, for the year 2013-14 less than two weeks ago. In usual understated ABS style, it contains some pretty interesting results.
This survey is run every 2 years and aims to measure the tenure of Australian households, and how much they are spending on housing. This is quite topical at the moment, particularly with the recent increases in prices in Sydney and Melbourne. See my previous article about housing bubbles. There is lots of talk about investors pushing up housing prices and making them unaffordable.
This survey takes more of a national perspective, with some very interesting results that cut through the hype. It also has data for the past 20 years, sampled every 2 years, putting a long term trend on this.
Basically, at a national level, we still have about 2/3rds home owners, and most are not in housing stress. In fact the proportion of average income spent on housing is not increasing!
- Across all households nationally, we are spending an average of 14% of our gross household income on housing costs. This is less than half the amount which would put a household into mortgage stress (30%) by the accepted definition.
- Also note that this is not just mortgage costs, but includes all recurrent housing costs, such as rates and water.
- Renters pay the largest share of their income on housing, at 20%, but this has remained extremely steady for the last 20 years, increasing only from 19% in 1993-94!
- Over the same time frame, due to record low interest rates, households with a mortgage are now paying 16% of their income on housing, down from 18% 20 years ago.
- Ah, but what about first home buyers? Surely those who bought in recently are paying more. Well, they are, but they always have. First home buyers are paying on average 22% of their income on housing costs. The survey doesn’t show this over time, but it does equate to a $ value of $558 per week, compared to all mortgages at $465 per week. This figure has increased just $100 per week after inflation, in the past 20 years. And low interest rates mean that the average cost for all mortgage holders has remained virtually unchanged from the $448 recorded in 2007-8.
- Also in 10 years, rents have consistently increased, from $308/week in 2003-4 to $420 now. While mortgage holders can benefit from lower interest rates, renters generally don’t – though they also don’t have extra costs like rates, which are paid by the landlord.
- Home ownership overall, has declined slightly over 20 years, from 71.4% in 1993-4 to 67.2% in 2013-14, about a 4% decline. Renting has correspondingly increased to 31.0%, with a larger increase in private renters from 18.4% to 25.7% over 20 years, while public housing tenants have halved to 3.6% in that time.
- Within the home ownership category, there has been a shift from full home ownership (41.2% to 31.4% over 20 years) to mortgages (29.6% to 35.8%).
- Average household size is on the rise again, at 2.59 people per dwelling – this is higher than it’s been since the 1999-2000 survey.
So, does this mean there is no problem with housing affordability? Yes and no.
Despite price increases, it’s clear that at a national level, the amount people are paying on their mortgages is not increasing dramatically. Housing purchase is as affordable as ever. Rents, however have increased quite a bit. And at the same time there is a shift from full home ownership into mortgages and renting. Part of this is due to the large migration intake over the past decade, with migrants more likely to rent. Part, however is undoubtedly due to an escalation in housing prices – so that while they may not be paying more in real terms, people are taking longer to pay off their homes.
And while there may be no problem nationally, this is likely to hide issues at the local level. Certainly most of the focus of the housing debate has been on Sydney and Melbourne. The survey actually shows that Sydney and Brisbane are the places to watch, with around 21% of households with a mortgage having housing costs over 30% of income in 2013/14. The equivalent figure for Melbourne was 17%.
Another interesting finding is that among first home buyer households, the lower the value of your dwelling, the MORE LIKELY you are to be paying a high proportion of your income on housing costs. Such that the median value of dwellings for those paying less than 25% of their income on housing costs was $524k, while for those paying 50% or more it was $437k. This may indicate an “entry level” effect, meaning that it is very hard for lower income households to get a foot in the market without spending a large proportion of their income on housing.
So while, overall, the survey doesn’t show dramatic results of unaffordable housing, there certainly are some doing it tough. And just because it’s affordable on average, doesn’t mean it’s affordable in your area, or affordable to all.
And of course, when (not if) interest rates rise again, we may see a different story for those with mortgages.
It’s really all about location and your demographic characteristics. For instance, some recent work we did found that several key worker groups couldn’t afford to rent anywhere in the City of Parramatta. In the end, it’s all about place again.