How no religion became the most common religion in Australia
Of all the topics in the Census, religion seems to be the one that generates the most discussion. The Census is the only reputable source of data on religion in Australia, but it’s also the only optional question on the Census form. In the 2016 Census, the ABS made an important change to the religion question on the Census form, placing the option for “no religion” at the top of the answers. This arguably affects the results, but let’s have a look at what they actually were.
Religion in Australia
We can see the most common religions in Australia in 2016 in the table below. In the 2016 Census, there were more responses for “no religion” than any actual religion – the first time that this has happened. In this table we have excluded persons who did not state their religion on the Census form. When “not stated” responses are excluded, one-third of Australians have no religious affiliation. The increase in the “no religion” category increased by 88% between 2006 and 2016, i.e. it almost doubled. There was an even larger increase in no religion between 2011 and 2016, which may be attributable to the change in the ordering of responses on the Census form. Given that in 2011 “no religion” was ranked second after Catholicism, and that the numbers have been increasing for several Censuses, this is not a surprising result. When the results are considered by age (see below) it also suggests that over time, Australia is becoming less religious. The reasons for this are largely speculative and are not the focus of this blog.
Most common religions in Australia, 2016 |
||
| Religion | Number | Proportion* |
| No religion** | 7,040,717 | 33.3% |
| Catholic | 5,291,834 | 25.0% |
| Anglican | 3,101,185 | 14.7% |
| Uniting Church | 870,183 | 4.1% |
| Christian (nfd) | 612,371 | 2.9% |
| Islam | 604,240 | 2.9% |
| Buddhism | 563,674 | 2.7% |
| Presbyterian and Reformed | 526,689 | 2.5% |
| Eastern Orthodox | 502,801 | 2.4% |
| Hinduism | 440,300 | 2.1% |
| Baptist | 352,497 | 1.6% |
Source: ABS, Census of Population and Housing (2016)
*Proportion does not include persons who did not state their religion. Religion typically has a high non-response rate (in this case 9.6%) so proportions may be misleading if the non-response is included in the calculation. **Also includes secular beliefs and other spiritual beliefs.
Religious diversity
Despite the increase in the “no religion” category, overall Australia remains predominantly a Christian nation, with around 57% of people nominating a Christian religion in the 2016 Census.
The most common non-Christian religions are Islam (604,240 persons, or 2.9% of the population) followed by Buddhism (563,674 or 2.7%) and Hinduism (440,300 or 2.1%). This is a minor change from 2011 when Buddhism was the most common non-Christian religion. However, Hinduism far outstripped the growth of the others with a 60% increase between 2011 and 2016 – a legacy of the high rate of immigration from India in this time.
Is everyone losing their religion?
When we consider no religion by age, we can see evidence of an inverse relationship between those with no religious affiliation and age, as shown in the graph below. The “no religion” response was far higher for those aged under 45 years, and the proportion declined with age.
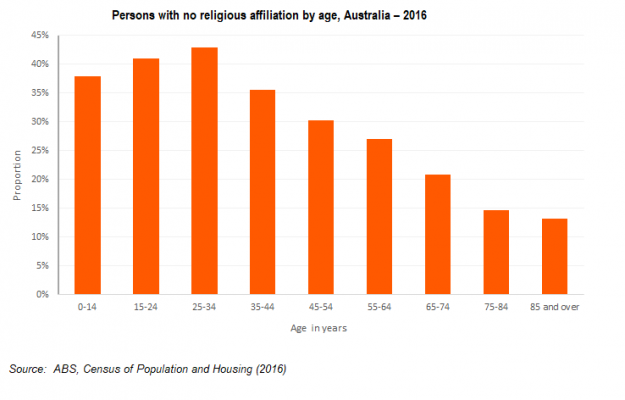
25-34 year olds were most likely to have no religious affiliation (43%), followed by 15-24 year olds (41%). This compares with just 15% of 75-84 year olds and 13% of persons aged 85 years and over. With younger people far less likely to nominate a religion, perhaps it’s not surprising that no religion is now the most common response to this question on the Census form. If this trend continues, perhaps one day we will reach a point where no religion is the dominant religion in Australia, rather than the most common.

.id is a team of population experts who combine online tools and consulting services to help local governments and organisations decide where and when to locate their facilities and services, to meet the needs of changing populations.
Access our free demographic resources and tools here
Simone - Myth Buster
Simone has a rich background in human geography, demography and urban planning – a background that was useful in her previous roles in the Commonwealth and State Governments, and now as part of the forecast team at .id. From the Queensland coast to the southern suburbs of Perth, Simone produces population and dwelling forecasts that help local governments make informed decisions about future service and planning needs. She is a regular contributor to .id’s blog and has spoken at several conferences on how our cities and regions are changing. She is a big advocate of evidence-based planning and how Census and other data can inform this. Outside of work Simone is a keen traveller and photographer – interests that tie in well with her professional life and help her to understand “place”.


