The changing fortunes of population growth – Sydney and Perth
One of the more interesting demographic trends in the last couple of years has been the turnaround in the fortunes of Sydney and Perth. Just a few short years ago Perth was the fastest growing capital city in Australia and was recording historically high volumes of growth. The latest ABS population data shows that population growth has halved in just the space of two years. On the other hand, after years of moderate growth, Sydney is going gangbusters. Let’s have a closer look at the spatial patterns of population change.
Sydney – rapid growth on the fringe, and in established areas
Sydney is now home to Australia’s fastest growing LGA. It’s been a while since this has happened, with various LGAs in Perth or Melbourne taking this prize in recent years. In 2014-15, Camden, located on the outer south western fringe, recorded a population growth rate of 7.6%. This was a slight increase on the 2013-14 figure of 6.2%. It’s often recorded the fastest growth rate in Sydney, but the rate and volume has increased considerably in the last couple of years. There are numerous development fronts in Camden as evidenced by the rapid growth of new housing estates in Gregory Hills, Oran Park and Spring Farm. In addition, there is considerable scope for future residential development across the northern part of the municipality well into the future, so high growth rates will be the norm for some years to come.
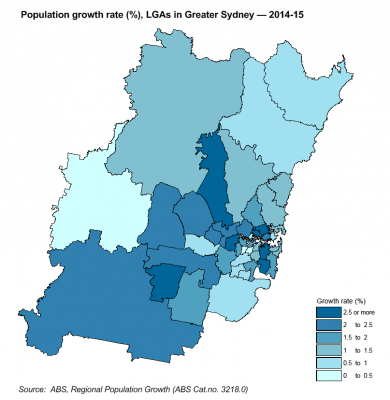
The map below shows the population growth rate recorded in 2014-15. About one in three Sydney LGAs recorded a population growth rate upwards of 2.0% – well above average. Aside from Camden, other rapidly growing LGAs include those in the inner city – Botany Bay (4.2%), Sydney (3.6%), parts of the lower north shore – Lane Cove (3.4%), Willoughby (3.0%) – as well as Auburn (3.1%), located on the Parramatta Road corridor. The driver of growth in the established areas is primarily apartment blocks. For example, some very large projects were completed in Botany Bay during 2014-15 such as Mascot Square and this trend is likely to continue over the next few years as there are currently many more large projects under construction, or are in the planning stage. Despite recent concerns that many apartments in such projects are vacant, they are still a source of new housing supply, home to new residents and contribute to population change in an area – after all they don’t have vacancy rates of 100%.
Perth – growth has moderated, but overall still strong
We’ve been aware of the slowdown in Perth’s population growth for some time, and it’s quite evident in the 2015 ERP data. While the spatial pattern of population growth and change remains relatively unchanged, ie growth on the fringe and selected established areas, the volumes and rates have declined significantly from the heady heights of just two years ago. In fact, a number of LGAs declined in population, including many of the smaller ones in the western suburbs (hence subject to statistical volatility). Claremont (1.6%) was an island of growth in a sea of population decline. The only other LGA in greater Perth to record population decline in 2014-15 was Bassendean (-0.5%), after almost a decade of continual growth.
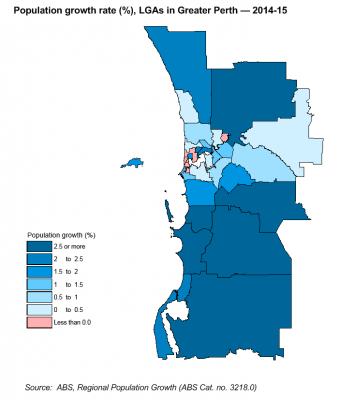
The map below show the population growth rate for Perth’s LGAs in 2014-15. Despite the decline in population growth, overall the rate recorded for Greater Perth (1.6%) is still above the national average. Many LGAs are still growing strongly – just not at the very high rates recorded a few years ago. Around one in three LGAs grew by more than 2.0% – the same ratio as Sydney. Most of the outer south recorded strong population growth, and Serpentine – Jarrahdale recorded a rate of 7.2% – not only the strongest rate in Perth, but only second to Camden in outer Sydney. Other LGAs in the south to grow strongly were Armadale (4.4%), Kwinana (3.9%), Rockingham and Murray (both 3.1%).
Swan was the fastest growing LGA north of the Swan River, also growing at 3.1%. It has recorded strong growth for the last decade but has always been far outstripped by Wanneroo. Things are starting to change. In 2014-15, the volume of growth in Swan (4,052) almost surpassed that of Wanneroo (4,250). While Swan’s growth has been strong and steady for the last decade, Wanneroo’s peak growth occurred in the second half of the last decade and has been declining since as land development opportunities are realised – despite considerable residential supply in the north of the LGA.
The latest population release from the ABS shows the importance of keeping up to date with ever changing trends and it raises some interesting questions. How sustainable is the current rate of growth in metropolitan Sydney, especially apartments? Will the downturn in Perth’s population continue and how will this play out spatially? It’s these sorts of questions that keep us on our toes here at .id and we are always keen to share our insights with our readers, and hear your thoughts as well.
.id is a company of demographers, population experts and spatial analysts. Access our free demographic resources here.
Which age groups are growing fastest in Australia, read our ebook: Three growth markets in Australia
Simone - Myth Buster
Simone has a rich background in human geography, demography and urban planning – a background that was useful in her previous roles in the Commonwealth and State Governments, and now as part of the forecast team at .id. From the Queensland coast to the southern suburbs of Perth, Simone produces population and dwelling forecasts that help local governments make informed decisions about future service and planning needs. She is a regular contributor to .id’s blog and has spoken at several conferences on how our cities and regions are changing. She is a big advocate of evidence-based planning and how Census and other data can inform this. Outside of work Simone is a keen traveller and photographer – interests that tie in well with her professional life and help her to understand “place”.


