In terms of the age structure, Tasmania is often referred to as Australia’s oldest state.
In 2014, the median age in Tasmania was 41.5 years, compared to the Australian figure of 37.3. It also has the highest proportion of persons aged 65 years and over at 18%, i.e. almost one in five. Like other ageing societies, the median age has been slowly creeping upwards over the last few decades.
Certainly the challenges of an ageing population cannot be underestimated, but as with all things demographic it’s important to consider the spatial differences. There are actually parts of Tasmania with a younger age profile. Using data from the ABS, let’s have a look at some of these areas.
What are the oldest and youngest parts of Tasmania?
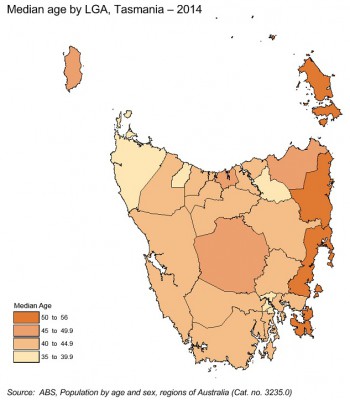
The map below shows the median age in Tasmania’s Local Government Areas (LGAs). Of Tasmania’s 29 LGAs, just six had a median age under 40 years, and only one (Brighton) had a median age less than the Australian figure. These younger LGAs were either located in and around Hobart and Launceston, with the exception of two on the north coast – Burnie and Circular Head. The latter is quite intriguing as it is a more remote rural LGA with a small population, but there is lower proportion of persons aged 65 plus compared to other parts of Tasmania and this might be a factor in the younger median age.

At the other end of the scale, there were four LGAs with a median age of more than 50 years – Flinders was the highest at 55.2 years. The others were Glamorgan/Spring Bay, Tasman and Break O’Day – all located on the east coast. These areas are rural, but they also have the high amenity factor and slightly milder climate that attracts retirees.
Brighton – Tasmania’s forefront of urban expansion?
Brighton Council, covering parts of Hobart’s outer northern suburbs and peri-urban areas, is the youngest LGA in Tasmania as measured by median age (35.0 years). At 2014, it had a population of 15,819, a marginal increase of just 0.1% on the 2013 figure. In the 2000s, it recorded relatively rapid growth typical of greenfield areas on the fringe of metropolitan areas, but growth has slowed considerably in the last few years. Pockets of greenfield land in Old Beach, Gagebrook and Brighton itself were still being developed between 2006 and 2011. At that time, the average annual growth rate was 2.0%, more than double the Tasmanian average. However in the years since 2011 it has slowed to an average of just 0.3%, in line with an overall decline in Tasmania’s population growth rate.
.
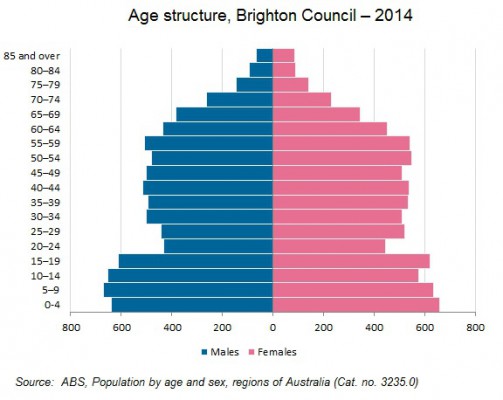
The age pyramid for Brighton Council is shown below. It is typical of a suburban area that has been growing over a long period of time, with the bulge in the bottom of the pyramid representing a higher proportion of 0-15 year olds, a dint in the pyramid representing an outflow of young adults in their twenties, and a relatively similar number of people in the age cohorts from 30-59 years. There is a relatively small proportion of very elderly persons in the population. From the age of 75 years there are more females than males, with the sex ratio becoming more extreme at the upper end of the age spectrum.

Hobart City – another enclave of young adults
Like many inner urban areas of Australian cities, Hobart City is home to a greater proportion of young adults. However, due to the much smaller size of the Hobart metropolitan area, it is a diverse area and there are a number of demographic influences at play. Hobart City’s median age in 2014 was 38.8 years – this is higher than other CBD councils in Australia but it does include older suburban areas such as Lenah Valley. The younger age structure is heavily influence by the location of the University of Tasmania campus at Sandy Bay, and the associated on campus accommodation, not to mention students who might be renting in surrounding suburbs.
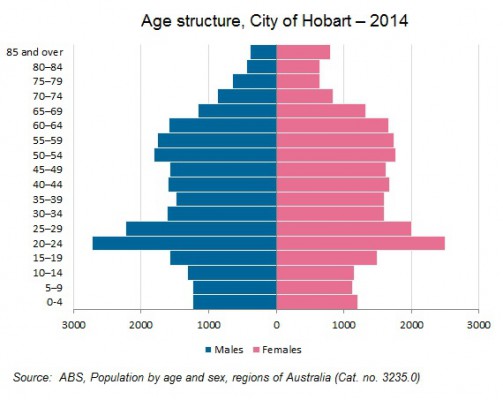
The age structure of Hobart City is shown below, and the size of the 20-29 years cohorts relative to the rest of the population is clear to see. Almost one in five people in Hobart City in 2014 were aged 20-29 years.
The importance of geography and service planning
The case studies shown here are further examples of how the composition of the population differs considerably across a geographic area. Spatial differences become even more apparent when you drill down to suburb or other micro level geography, and we’ve provided numerous examples of this in the past. Having access to the right demographic tools allows councils to plan for service delivery using the evidence base. Our Tasmanian client base includes Flinders Council with a population less than 1,000 persons – so it’s not just for large metropolitan councils. In total, over 250 councils in Australia, and a growing number in New Zealand subscribe to one our more of our local government products. Will you be one of the first councils to make use of our skills and services in 2016?


