Population densities of Australian capital cities
How dense are we? Population densities have traditionally provided information on the distribution of populations across space. By assessing how dense an area is in terms of population, we can determine possible pressures on existing services and infrastructure, remoteness of a community, opportunity for growth and expansion of communities as well as strategies for redistribution of population from denser areas to less dense ones. Incorporating population density analysis into strategic planning of cities also allows us to visualise areas which may produce additional pressure on existing transport corridors, public transport and plan for new services and infrastructure for future population growth in currently ‘dormant’ areas (i.e. upcoming greenfield/brownfield growth areas). In many Australian cities, population density maps will show similar trends – very high population densities in city centres, high/moderate densities in inner established suburbs which may be densifying over time due to demand/proximity to amenities and a lower population density on the periphery of a city where land scarcity constraints and high demand for housing are not such limiting elements.
Factors which affect population density are physical and anthropogenic; Physical limitations which may increase/decrease or direct certain patterns of population density include geography/topography constraints, climate and accessibility to resources and services/remoteness. Anthropogenic/human factors include political stability – people desire to live in an area which provides security and the ability to prosper, socioeconomic benefits and pull factors – such as cities and parts of cities which provide employment and education opportunities, as well as general attractiveness and desire to live in a city or certain parts of a city due to what it has to offer.
This series of blog articles explores the 2011 population density of Australian capital cities (by SA1 as the geographic unit) and analyses what it is that dictates the population density distributions in these cities. As a population forecaster, I see population density analysis as an important way of maintaining or increasing living standards which currently make many cities in Australia quality places to live in for existing residents and a desirable destination for migrants from within Australia and from abroad. The information is illustrated in thematic 3D maps (extruded and colour coded by population density per km2) with commentary on each city attempting to give readers a bit of insight into the similarities and differences between our state capitals and comparing certain densities to those of other world cities.
Part 1
- Greater Darwin – 2014 Preliminary ERP – 140,400
- Greater Hobart – 2014 Preliminary ERP – 219,200
- Australian Capital Territory – 2014 Preliminary ERP – 386,000
Part 2
- Greater Adelaide – 2014 Preliminary ERP – 1,304,600
- Greater Perth – 2014 Preliminary ERP – 2,021,200
- Greater Brisbane – 2014 Preliminary ERP – 2,274,600
Part 3
- Greater Melbourne – 2014 Preliminary ERP – 4,440,300
- Greater Sydney – 2014 Preliminary ERP – 4,840,600
Darwin, Northern Territory

Greater Darwin 2011 population density (per km2) by SA1 geography
- Darwin – the tropical capital of steady year-round 30-32 degree temperatures may look relatively simple and uniform in terms of population densities but there are some areas worth commenting on.
- While most of outer Darwin (Berrimah – Coonawarra – Winnellie, Lee Point) has very low population densities (1.17 persons per km2), the “urban island”, as my colleague Johnny would call it, of Palmerston is visible to the south, with the suburb of Durack illustrating the highest population densities – 1,972 per km2 within six SA1s. Palmerston as a whole has a slightly lower population density of 1,380 per km2 – similar to that of Winnipeg in Canada.
Note – Comparisons to other world city population densities will be made throughout this blog series however I acknowledge that this is a slightly flawed technique as we are comparing a segment (and associated population density) of one Australian city to an entire city (and its population density) elsewhere in the world but this is done just to provide some context in terms of density, built form, the urban environment and possible stresses on infrastructure. - Back in Darwin, north of McMillans Road, several suburbs illustrate population densities similar to those of larger capital cities such as Brisbane, Adelaide or Perth. Coconut Grove, Alawa, Moil, Anula, Karama, Wagaman, Wanguri, Wulagi, Leanyer and several other suburbs make up just over a third of Greater Darwin’s total population with the SA1s hugging the coast around Casuarina Drive and Banksia Street illustrating some high densities, as seen on the map.
- Darwin’s densest areas in terms of population are in the CBD, where over 90% of the dwelling stock is classified as “high density”. Two of the ‘towering’ SA1s which stand out on the map in central Darwin are located on both sides of Smith Street with a combined SA1 usually resident population of 1,318 (2013) and a high population density of 9,414 persons per km2.
Hobart, Tasmania

Greater Hobart 2011 population density (per km2) by SA1 geography
- The population of Greater Hobart according to the preliminary ERP was 219,200 in 2014 (2011 Census population – 211,656). This makes up about 43% of the total population of the state of Tasmania as at 2011.
- Most of Greater Hobart’s population is concentrated on the eastern and western shores of the Derwent River estuary – with the main urban area extending from Bridgewater in the north, southward to Taroona with another urban “island” on the map in the southeast illustrating Kingston and Blackmans Bay.
- Central Hobart can be seen as the most densely populated segment on the map with several areas illustrating population densities of 2,800-3,800 persons per km2. Unlike cities such as Melbourne, the actual city centre is still predominantly occupied by commercial buildings and businesses whereas it is the immediate ring outside the business district which exhibits higher population densities – North Hobart, West Hobart, Sandy Bay and Battery Point being the most dense areas with New Town also displaying similar population densities as North and West Hobart.
- On the other side of the river, in the north, the suburb of Risdon Vale which is approximately 1.5km from Risdon Cove can be seen on the map and has a 2013 preliminary estimated resident population of approximately 2,734 and a population density of 1,523 persons per km2.
- Further south, the connected suburban areas of Lindisfame, Rose Bay, Montagu Bay, Bellerive, Mornington and Howrah complete the eastern side of Hobart. A couple of SA1s in Howrah with relatively high population densities 2,600-2,900 persons per km2 do have a few semi attached dwellings but are mainly just single dwellings with not much other land use other than roads in the area – hence the higher population density. This example illustrates that some areas of higher population density aren’t necessarily areas composed of a larger share of medium or high-density dwellings but could just be areas which are somewhat homogenous in land use/design with principally housing in the area and sparse sections of green space/parks or no green space in the mix at all.
- To the east of Howrah and Tranmere, both on the shore, are a couple of other suburbs which appear on the population density map – Rokeby and Clarendon Vale which also have a rather homogenous housing stock type of stand-alone dwellings (though these may differ in size/number of rooms, for example).
- Continuing east from Rokeby and Clarendon Vale, situated on the isthmus which connects the South Arm Peninsula to the mainland are the suburbs of Lauderdale and Roches Beach (City of Clarence) with a few east-facing SA1s illustrating quite high population densities for such a remote area (approximately 2,361 persons in 2013, with a density of 1,149 persons per km2).
- Finally the township of Dodges Ferry (Sorrell Council) on the eastern side of the entrance to Pittwater (on the far eastern side of the map) stands out from the rural surroundings. With a 2013 preliminary ERP of approximately 2,987 (2011 Census population = 2,974), the western SA1s are all made up of stand-alone housing which contain almost 70% of the township’s population at an average population density of 885 persons per km2 – comparable to Cincinatti or Wichita in the USA.
Australian Capital Territory
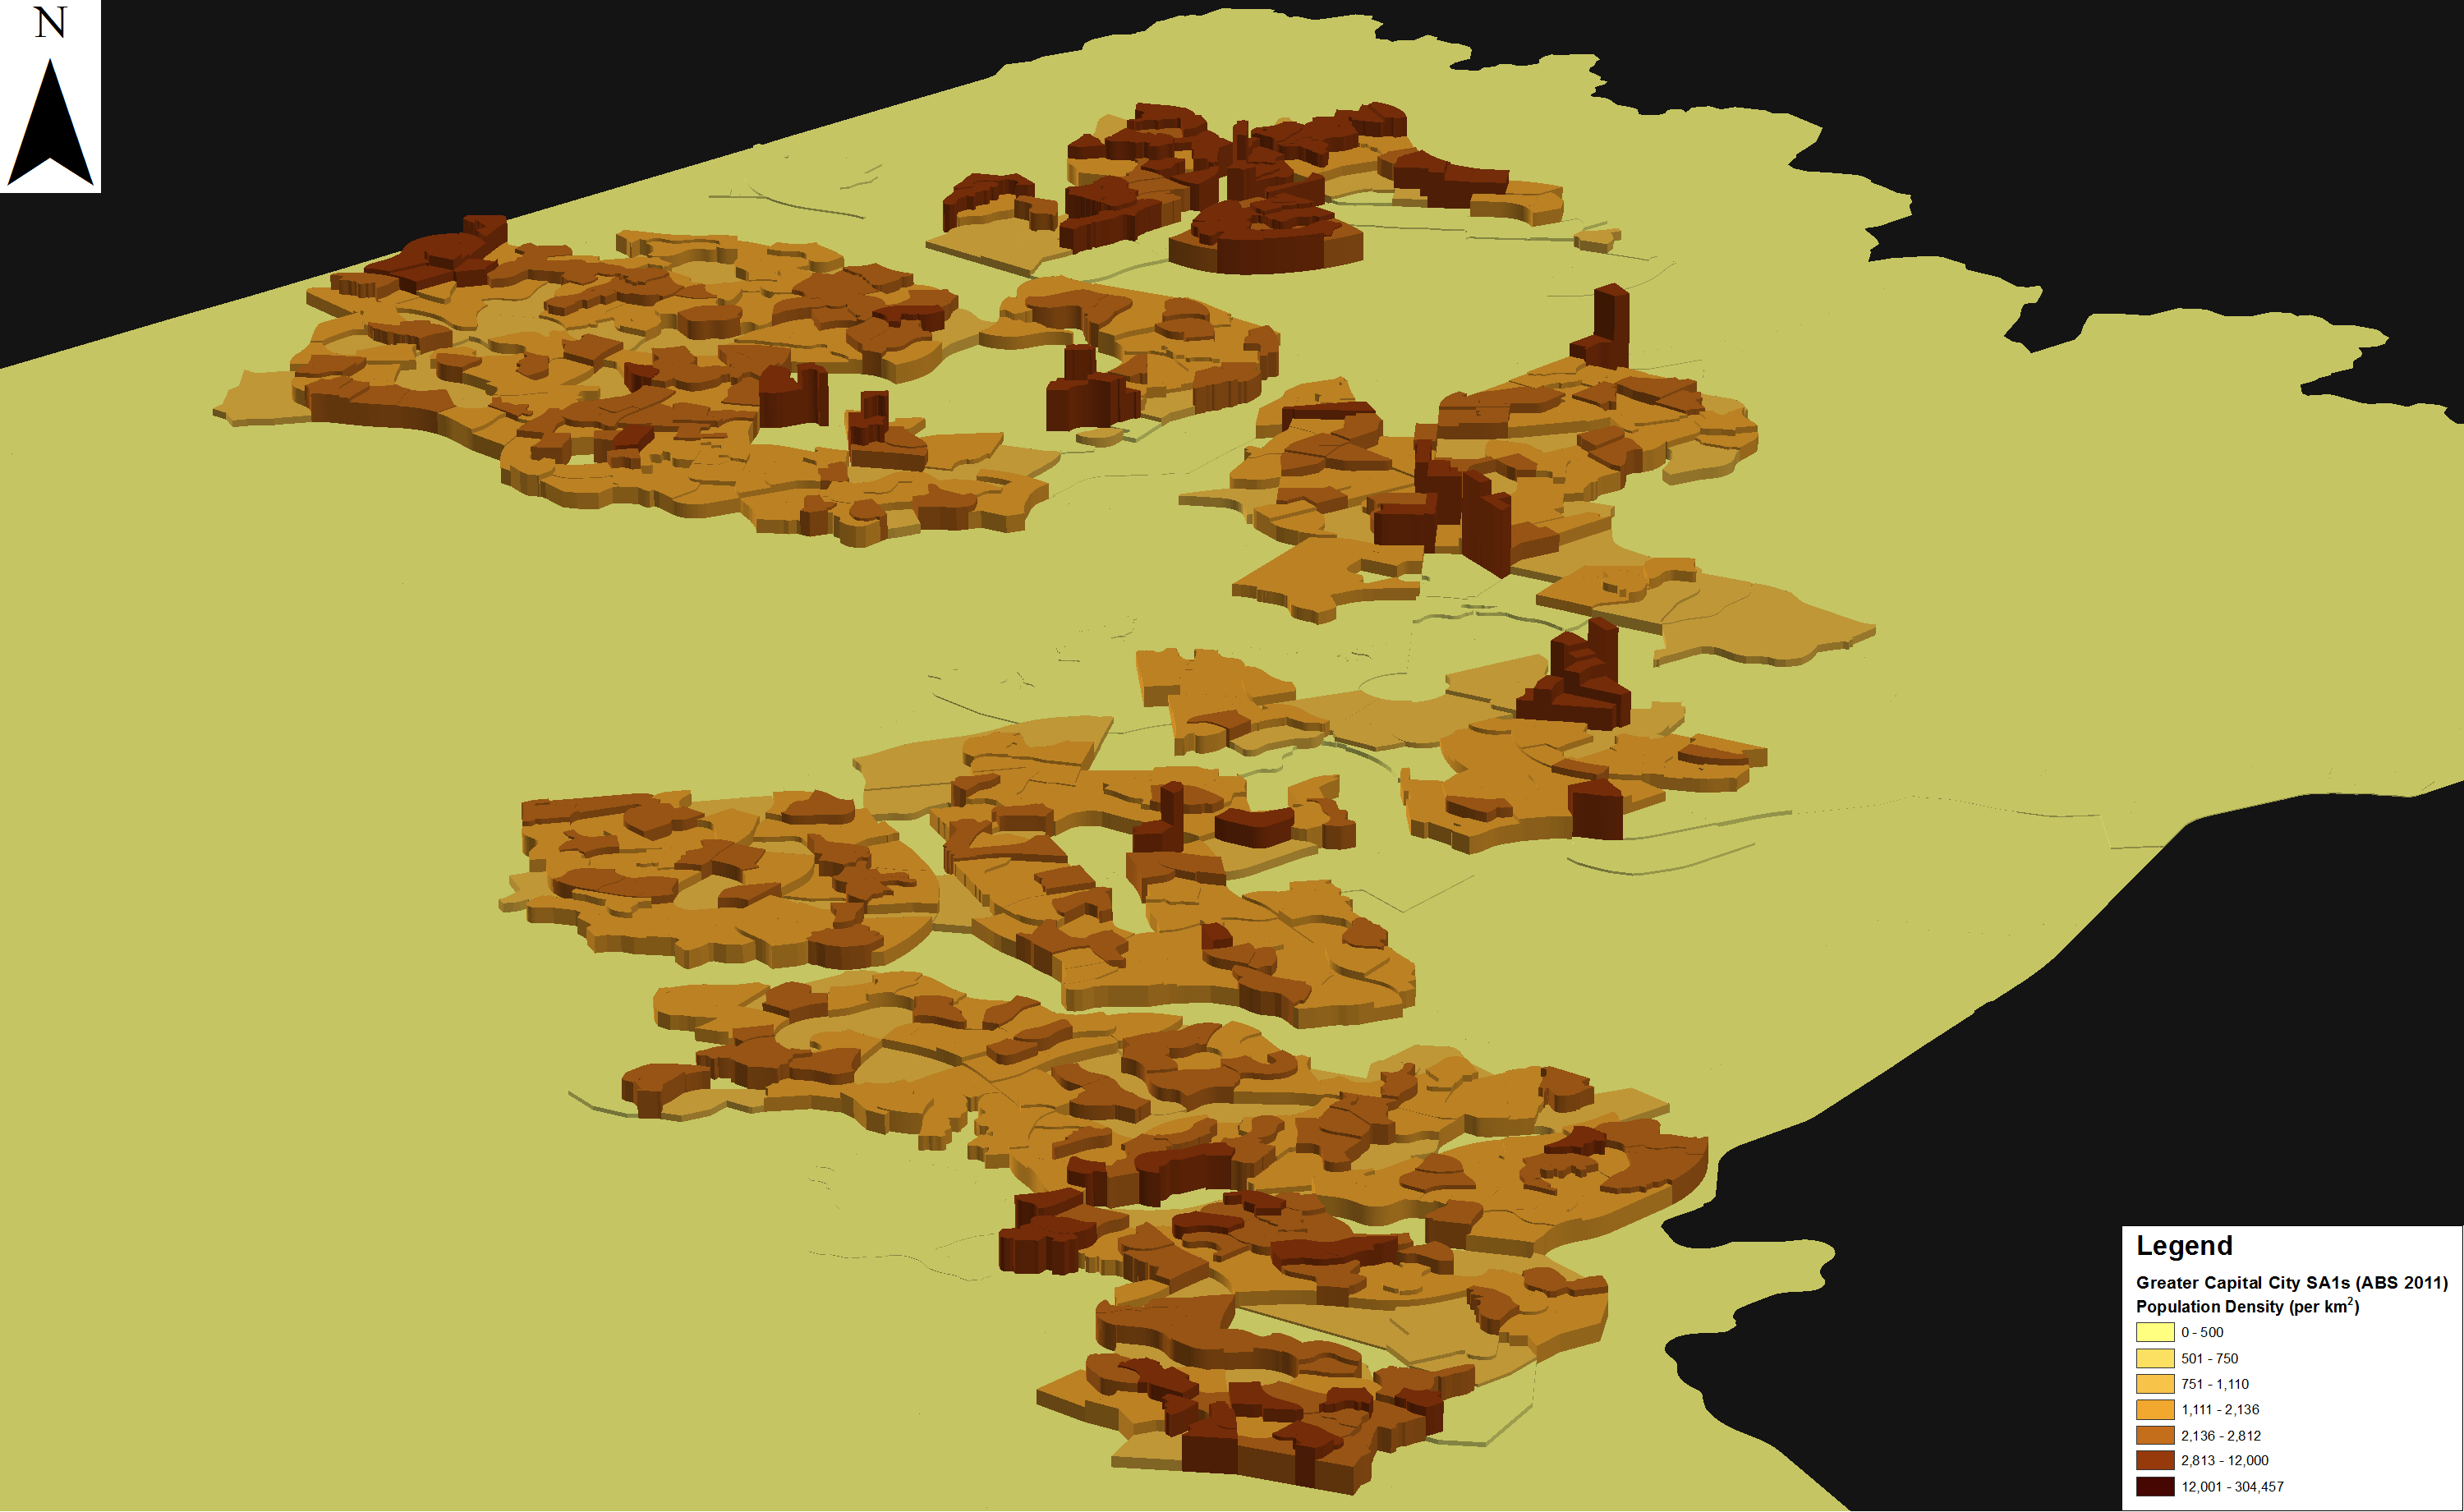
Australian Capital Territory (ACT) (‘Greater Canberra’) 2011 population density (per km2) by SA1 geography
- The nation’s capital of Canberra is another planned city (like the City of Adelaide) which was selected as a site for a new capital in 1908 – a compromise between the “giants” of Melbourne and Sydney (Lewis 2006). It was officially named in 1913 and from then grew to fulfil Walter Burley Griffin’s planned city ‘wheel and spoke’ design with the outer area districts of the city being built out after in the early 1900s, throughout the last century and even recently with the commencement of the District of Molongo Valley in 2010. These latter district developments did not follow the original Canberra Central geometric design.
- In 2014, the preliminary population of the ACT was 386,000, an increase of 28,779 from the 2011 Census.
- On the population density map, a few areas in the Canberra Central district stand out. On the south side of Lake Burley Griffin, a pocket of SA1s in Kingston, a wedge between Wentworth Avenue and Canberra Avenue has a higher proportion of high density dwellings (namely apartments) which makes the area stand out in terms of population density (3,511 persons at a population density of 5,615 persons per km2. Quite different to the surrounding areas of stand alone houses and some semi-attached houses which have population densities of 800-1,200 persons per km2.
- North of the lake, along the north/south Northbourne Avenue corridor – several SA1s with apartment and older brick flat buildings also have population densities higher than the surroundings.
- The District of Gungahlin, seen in the north-most segment of the population density map, displays some of the highest densities even though most of the SA1s up here are composed of stand alone houses at a density of around 10-13 dwellings per hectare.
- Southwest and across the A25 of Gunghalin, the District of Belconnen, built in the 1960s also stands out on the map although with lower population and dwelling densities. When examined on an aerial photo map, these densities are lower due to the nature of suburb design – more green spaces and non-populated land, thus decreasing the population densities.
- The new suburb of Casey does not stand out on the density map yet as the 2011 population of the suburb is approximately 1,462 – around 558 persons per km2. By 2013 however, the development of greenfield estates increases the population to approximately 2,881 based in 2013 preliminary SA1 results (note – 2014 preliminary ERP figures indicate a population of 3,813 for the area, this would be a density of 1,454 persons per km2 – a near threefold increase on 2011.
- The (even newer) suburb of Moncrieff in the District of Gungahlin currently has no completed/occupied dwellings (based on March 2015 aerial imagery) but is expected to accommodate up to 1,800 residential dwellings. Based on the current earthworks footprint, this could be a density of 2,450-2,540 persons per km2 – similar to that of Cologne in France or Rotterdam in the Netherlands (link).
- The population densities in the 1960s-1970s suburbs of Weston Creek and Tuggeranong (south of the centre) display similar population density and layout characteristics as other suburbs in the ACT which were built around that era with a dwelling density of around 8-10 dwellings per hectare – most are stand alone houses with some areas being higher in density due to the presence of multi storey flat buildings. Overall, these older suburbs tend to have slightly larger residential land parcels and a higher mix of residential areas with green space pockets, thus exhibiting lower population densities whereas the recent and newly emerging suburbs have a more mutually exclusive zoning design style of areas/SA1s with a higher residential land development saturation along areas specifically designed as distinct green space allocation – coupled with smaller parcels, the densities of dwellings in these new areas are around 10-12 dwellings per hectare.
The next blog entry in this series will explore the next three State capital cities – Greater Adelaide, Perth and Brisbane.

Nenad Petrović
Nenad’s background is in geosciences and geographic information systems. At .id, Nenad has experience as both as a demographer and population forecaster. His areas of expertise are place-based analysis, identifying spatial patterns in demographic trends, community profiling, catchment analysis and an understanding of role and function of different communities.


