Australian Population Grid – a new view of population density
The ABS has a habit of releasing interesting things just before Christmas. In 2014, they released a brand new view of Australian population density, enabling mapping which shows our population distribution in better detail than ever before. It’s called the Australian population grid, and you can find it on the ABS website.
The Australian Population Grid does away with irregularly shaped and sized SA1s, Collection Districts or Meshblocks, and divides Australia into a uniform 1km * 1km grid. This means that the grid cells are much more coarse in metropolitan areas but much more detailed in regional areas – but since they are uniform, population density can be easily mapped at scales from a city to the whole country, which means you can see patterns which would have been hidden at the mesh-block level.
Only total population figures are available, so this is not a dataset for detailed analysis, but for mapping.
The ABS have produced some maps, below and the Guardian website reproduced two versions:
- With a log scale, enabling a clear differentiation of densities in urban and rural areas.
- With place names overlaid.

A few observations on a national level:
- We remain a nation of “coast huggers” – particularly the Eastern Seaboard, with relatively high population densities within 50km of the coast.
- This band goes all the way from Adelaide through Victoria, with a small gap in far East Gippsland, then up the coast to north of Brisbane.
- There is another band about 200-400km inland from the coast, of moderate population density, with less in the Great Dividing range in between. This band kind of mirrors the coastal population and represent the inland agricultural areas and major regional centres in Vic and NSW.
- Perth sits way out on its own, but with fairly dense coastal development in the SW corner as well.
- We still have this vast empty interior.
I actually find the Guardian log scale map shows this much more clearly. This is an interactive map which I can link here but not reproduce, so go and see for yourself.
The resolution within our major cities of this grid is not so good, so mesh-blocks may be better at looking at population density on an urban scale. Nevertheless, these enlargements by the ABS show Sydney and Melbourne fairly clearly. Sydney has a lot more areas of very dense population, including the most densely populated grid square in the country – around the Potts Point area, with 14,747 people. Just out of interest, the population density of Manhattan Island, in New York, is about 26,000 people per km2.
Sydney and Melbourne are the only places in Australia where there are any 1km squares with densities of more than 8,000/km2 Melbourne has just 1 grid square in this category while Sydney has 21. Naturally there would be smaller areas of higher density in both these cities and even our lower density cities like Brisbane, Adelaide and Perth, but at the 1km * 1km level, Sydney has almost all the high density.
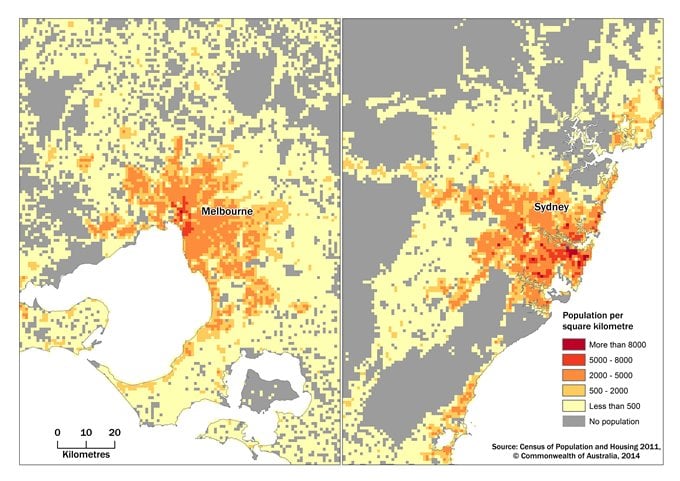
And the maps also show a good reason for that. Sydney is surrounded by rugged mountains and wilderness areas with no population. It can’t expand outwards much more so it has a constrained footprint. As we’ve discussed previously, Sydney is growing up more than it’s growing out now.
Have you found anything interesting in the Australian Population Grid?
Glenn Capuano - Census Expert
Glenn is our resident Census expert. After ten years working at the ABS, Glenn's deep knowledge of the Census has been a crucial input in the development of our community profiles. These tools help everyday people uncover the rich and important stories about our communities that are often hidden deep in the Census data. Glenn is also our most prolific blogger - if you're reading this, you've just finished reading one of his blogs. Take a quick look at the front page of our blog and you'll no doubt find more of Glenn's latest work. As a client manager, Glenn travels the country giving sought-after briefings to councils and communities (these are also great opportunities for Glenn to tend to his rankings in Geolocation games such as Munzee and Geocaching).


