17th Century author Abraham Cowley wrote:
May I a small house and large garden have, and a few friends, and many books, both true.
Cowley’s sentiment would still resonate with many New Zealanders today, although not all of us seem particularly inclined towards building small houses.
Recently, Stats NZ released November building consent figures, noting that the number of consents issued was a seven year high. As has been the trend, Auckland and Canterbury contributed the lion-share, this time 70 per cent of the 2,420 new dwellings.
| For planners and policy people, information on housing stock and changes over time is vital to understanding the role and function of a neighbourhood or district in a wider context. The number of bedrooms in a dwelling is an indicator of the dwelling size. And when combined with dwelling type information (separate house, medium or high density, non-private dwellings) the resulting profile provides a strong insight into the role an area plays in the housing market. For example, an area of high density dwellings that are predominantly 1-2 bedroom are likely to attract students, single workers and young couples, whereas a high density area with dwellings that are predominantly 2-3 bedroom may attract more empty nesters and some families. |
Of Auckland’s total of 967, almost half (442) were apartments. Conversely Canterbury’s 726 consents included only 32 apartments. The emphasis on intensification, affordability and “more houses fast” in Auckland is very different from the Christchurch post-quake rebuild. Yet even before the quake there were some interesting housing trends emerging from in and around Christchurch.
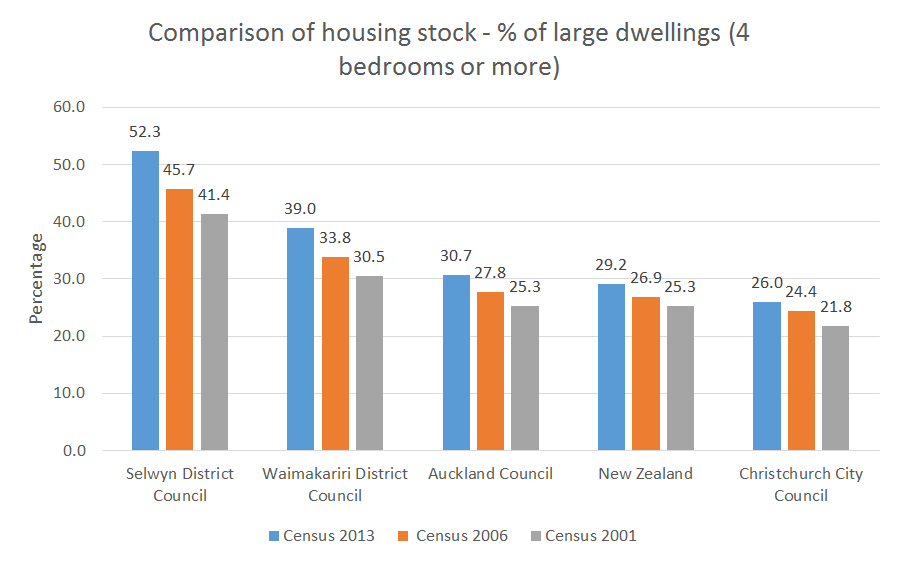
In Canterbury there are some extreme variances in house sizes across the districts clustered around Christchurch. Incredibly, Selwyn boasts a dwelling stock which is dominated by large dwellings (that is 4 bedrooms or more). The exact figure of 52.4% is notably higher than anywhere else in New Zealand – Waimakariri comes next with 39.0%. Take a moment to consider these figures in comparison to the national low of Kawerau at 19.4%.
It is interesting to compare Selwyn and Waimakariri – both major growth areas in Canterbury – with the central hub of Christchurch, and against Auckland as growth areas. The following chart tracks the upwards trend in the size of houses across those areas. The New Zealand benchmark is in there for reference. What you can also see is Selwyn, in the 2006 and 2001 pre Earthquake censuses, still registering high proportions of large houses.

Not surprisingly, Selwyn is very much a place for families and couples as is shown in the following chart. Also Selwyn has very few single person households (just 13.65%). Further investigation revealed that Selwyn has the lowest proportion of single person households in New Zealand by a sizeable margin (Porirua was next at 17.43%).

But what’s really interesting is that bigger dwellings do not convert into larger household sizes. The New Zealand average household size has been close to static over the last three censuses while in that time the proportion of large houses has increased from 25.3% to 29.2%.
In New Zealand average household sizes range from Porirua’s 3.01 people per household through to just 2 people per household in the Chatham Islands. Selwyn District ranks only third with an average household size of 2.85 persons despite its high proportion of large houses.
Clearly the increase in dwelling sizes is out of sync with household sizes both nationally and more particularly in Selwyn. Perhaps those extra bedrooms are simply being put to other uses and Selwyn is more attuned to the latter part of Cowley’s quote. Maybe the rooms are for those “few friends” to stay, or for a library of “many books” … or both.
If you are interested in understanding and comparing your council’s dwelling patterns to others, visit our demographic indicators site or demographic resource centre for a wide array of population and housing information.


