Lessons in over-simplifying statistics – or why I’m not such a Wally with water
I recently received a water bill.
I know, not exactly a newsflash! And bills are never fun – but what does this have to do with demographics?
Well this water bill had a tear off strip which compares my water use to the “typical use” (average?) in my area for similar properties.
I’m told these comparison tables are a fairly standard part of water bills these days, since the last drought, with comparison tables generally used to give a benchmark encouraging people to save water.
Our daily water use is 737L, compared to the average in my suburb, Ringwood North in the City of Maroondah, of 542L.
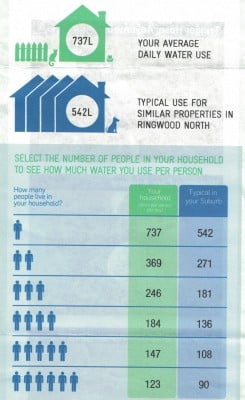
The tear off also includes a simple visual table which calculates water use per person based on how many people are in your household.
The table makes my family look like complete “Wallys with water” (for those who remember those ads from 80s – here’s one on YouTube). I thought this was a bit odd, considering that we have a rainwater tank for all our outdoor water use, which accounts for around 40% of total household water use.
There are 5 people in my household. According to this table, 5 person households in Ringwood North typically use 108 litres per person per day, while we use 147 litres per person per day. So we use 36% more than other 5 person households in the suburb?
But the problem here is that the table is very over-simplified. Clearly it is NOT the daily water use for 5 person households. What the per person table does is simply take the average water use for all households (possibly by all “similar properties”, which could mean separate houses rather than flats), and divide by an arbitrary number of people. The problem with this in terms of encouraging water conservation, is that households could reach the conclusion that to consume less water, all they need to do is add extra people!
It makes the single person households look like the real Wallys, while 6-person households are very thrifty with water! By this logic, a household of 100 people would be using a mere 5 litres per person!
Let’s try a different calculation on this. The Average Household Size for Ringwood North is 2.83 persons per dwelling. This is well above the metropolitan average but much lower than the 5 people I have in my household. Based on dividing 542L by 2.83 persons gives a figure of 192L per person.
So on a per person basis, our usage of 147L per person is actually not too bad. In fact it is possibly around 19% better than the average for the suburb, adjusted for household size.
So this table seems to adjust for household size, but in fact does not.It’s an example of trying to over-simplify statistics, and ignore a confounding variable.
Replacing this table with a simple “Water use per capita” average and allowing the householder to multiply this by the number of people in the household would be a much better option. Of course neither the water company or anyone else knows how many people live in each household (this is collected in Census but the unit record data is confidential, and in any case at an individual household level it is likely to change in between Censuses).
But there is a further factor here, which may make my family seem a bit more Wally-like again. There are economies of scale in larger households that mean that you generally won’t use as much water per person as, say, a 1-person household (eg. we have more dishes to wash, but are probably more likely to run the dishwasher full, and my two youngest kids often share a bath).
This means that simply multiplying by the number of people as I’ve suggested, while better than what is presented on the bill, isn’t providing a completely fair comparison either. You really need to know a genuine average for each household size.
As it turns out, a bit of searching on the web reveals that my water company has already done this analysis! They did a comprehensive survey in 2010 which looked at a range of issues around water use, down to the appliance level. It’s an interesting read:
https://www.yvw.com.au/yvw/groups/public/documents/document/yvw1003346.pdf
On page 18 of this report is a table which looks very similar to the one on the water bill.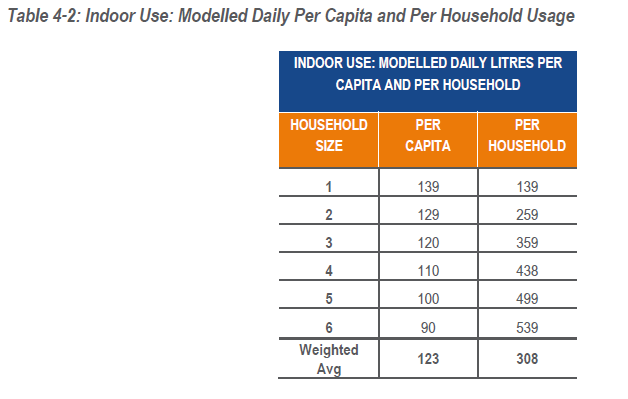
Note that this particular table in the report relates to INDOOR USAGE ONLY, and we know that around 40% of water use is outdoors, so it’s not comparable to the first chart here (besides this would make me look like a Wally again!). I couldn’t find it in the report but presumably it would not be too hard to produce something similar which does take into account total water use, and is adjusted for each suburb. This would be of much more use to households than the current table which makes single person households look very thrifty with water while making households of larger than average size look like Wallys.
What this is all getting to is the idea of an equivalising factor, which measures average water consumption per person in varying household size. In the same way, Equivalised Household Income which is on profile.id, adjusts for the effects of household size on income, and allows comparison of different sized households based on their income level. Larger households require more income than smaller households for the same standard of living, but due to economies of scale, it’s not just a multiple of the number of people, but based on a sliding scale.
The moral of the story? Rates and per capita data can be misleading if you don’t have the underlying categories that it’s based on to make an assessment. Always check the data you’re dealing with. In profile.id, we’ve done this for you, and if it’s in there, it means we think it’s a meaningful dataset to make comparisons on.
Glenn Capuano - Census Expert
Glenn is our resident Census expert. After ten years working at the ABS, Glenn's deep knowledge of the Census has been a crucial input in the development of our community profiles. These tools help everyday people uncover the rich and important stories about our communities that are often hidden deep in the Census data. Glenn is also our most prolific blogger - if you're reading this, you've just finished reading one of his blogs. Take a quick look at the front page of our blog and you'll no doubt find more of Glenn's latest work. As a client manager, Glenn travels the country giving sought-after briefings to councils and communities (these are also great opportunities for Glenn to tend to his rankings in Geolocation games such as Munzee and Geocaching).