‘Plan Melbourne’ carries through a commitment to containing urban sprawl, but as we show in our recent ebook , growth will remain focused in the outer suburbs over the foreseeable future. So as Melbourne pushes towards 8 million by 2051, where exactly will that growth be focused? Where are the growth suburbs of the future?

The recently released ‘Plan Melbourne’ contained quite a few changes in its blueprint for Melbourne’s growth, but there was one constant. A commitment to containing urban sprawl has been the ideological bedrock for planning documents from all sides of politics since as far back as the 1970s.
‘Plan Melbourne’ articulates a need to establish a firm, permanent boundary, and sets in place a mechanism for determining that boundary. However, it does not go as far as to say what it should actually be, or how to navigate the tricky politics of balancing urban sprawl against urban consolidation.
Because as Melbourne grows, then it must increase the dwelling stock either through greenfield development on the fringes, or infill development in existing suburbs. The latter potential reshapes the suburbs we know and love, with a greater focus on higher-density apartments and townhouses.
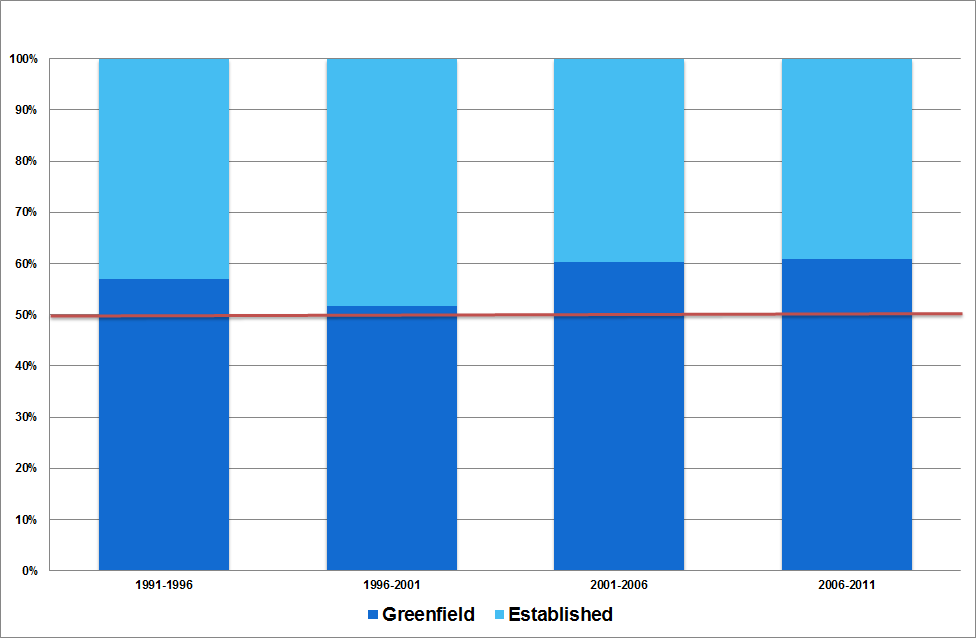
As such, local residents have often sought to defend the ‘character’ of their suburbs, and resist consolidation and higher density development. This makes greenfield development more attractive. When our demographers mapped the development of Melbourne suburbs over the past 20 years, what we found is that the share of greenfield development has actually been increasing.
Figure 1: New Housing Development, Melbourne, 1991 – 2011

There was some improvement between 1996 and 2001, when the share of new development occurring in established areas pushed towards 50%, but those gains were retraced, and in the two most recent Censual periods, greenfield sites had risen to account for 60% of new development.
To its credit, Plan Melbourne recognises the challenges, and in identifying ‘growth zones’ and ‘residential zones’ and in the promotion of satellite ‘activity centres’, it is more prescriptive than previous planning documents. However, the proof is in the pudding, and there will always be the temptation for future governments to tinker with the boundaries to avoid taking on established residents.
And so as Melbourne pushes towards 8 million by 2051, where exactly will that growth be focused? Where are the growth markets of the future?
We present detailed forecasts for Melbourne (and Sydney) in our e-book “Predicting the growth suburbs of the future” . In our view, the distribution of this growth will continue to be dominated by fringe areas, with the top 5 fastest growing LGAs being Wyndham and Melton in the West, Casey in the Southeast and Whittlesea and Hume in the North.
At the same time, the only urban consolidation LGAs featured in the top 10 are Melbourne and Moreland. (A detailed picture of how .id see this evolving over the next 20 years can also be found here, at our interactive map of Melbourne’s population growth.)
In sum, we expect that greenfield development will continue to dominate the development of Melbourne’s housing stock, and there will continue to be substantial pressure pushing up against Melbourne’s outer limits. The newly formed Metropolitan Planning Authority will have its work cut out for it.
At .id, we specialise in helping business understand the dynamics of change in their key markets. The analysis presented in our e-book “Predicting the growth suburbs of the future” is a essential starting point, but our small area forecasts can give you a street by street picture of growth and change.
For example, the Our Children Our Schools coalition recently won funding in the budget for a junior high school in Coburg. While the government was initially resistant, by using .id data and resources, the coalition was successfully able to demonstrate the need for a new school in the area.
How can .id help you understand your market?
.id is a team of population experts, who use a unique combination of online tools and consulting to help organisations decide where and when to locate their facilities and services, to meet the needs of changing populations. Access our free demographic resources here.


