.id’s demographic and economic tools are easy to use, and web-based so they are available for anyone to explore, online.
But we realise that council officers often get asked for a hard-copy (or PDF) summary of some key information – maybe as a handout for a presentation, information for potential investors, or suburb and ward summaries.
If you are one of these council officers, take heart. We have the perfect solution for you, and it’s already in profile.id, forecast.id and economy.id.
We have recently included a comprehensive, tailorable report writer.
To get started, in any of the tools, under “Downloads” in the left side menu, select “Reports”.

profile.id reports
If you want to simply have one report that tells the overall story, you can choose a report for the whole of your Council area, and ALL characteristics of your population. To do this, simply select “Download report” under “Pre-defined reports”. This is quite a large report, but it has lots of great information in it, and is well laid-out.
However, to tailor your report, under “Custom reports” simply select the area you want to look at (e.g. the whole Council area or any one of the “small areas”), the benchmark you want to compare with, and the comparison year in the grey toolbar.

Then, tick the boxes of the characteristics you want to see in the report.

forecast.id reports
Under “Custom reports” select the area you want to look at, and tick the boxes of the items you want in the report.

economy.id reports
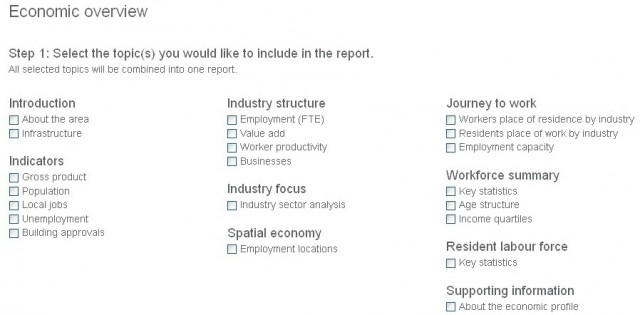
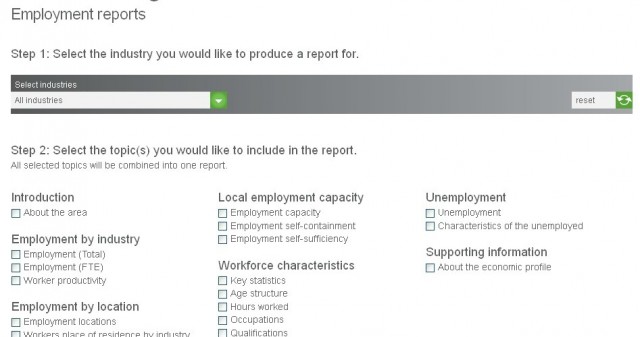
In economy.id, you can choose from Economic Overview, Industry Sector Reports or Employment Reports.
a) The economic overview reports could include information about the area, economic indicators, industry structure, industry focus, spatial economy, journey to work data and workforce summary.

b) The industry sector reports provide detailed information about each industry. Select the industry from the drop-down menu and then select the industry characteristics you would like to see.

c) Employment reports provide detailed information about employment in the area, and also outside of the area. Select an industry (or “all industries”), and then tick the characteristics you would like included.

How to get the reports
In any of the tools, after you have ticked the boxes of what you would like in the report, put your email address in the field at the bottom and click “send report”.

Then, check your emails within the next few minutes (normally just a few seconds!) and the report will be there, in a well-designed PDF format, ready to attach to an email, print out, put up on your website or include as an attachment to another report.
It’s that easy!
If you want to know more about your council area, check out the .id demographic and economic tools already available in the demographic resource centre.
If your council doesn’t currently subscribe to .id’s products, click here to learn more about how we can provide a comprehensive demographic and economic resource library for council decision making, strategic planning, business investment, grant funding and much more…


