Advanced users – Shift Share Analysis for calculating regional competitive advantage
There is a lot of great information in the economy.id sites that enable users to quickly tell a sophisticated stories about a local economy simply by interpreting the existing table, charts and analysis contained within each site.
However for those of you who want to go a little deeper with your analysis, economy.id can also provide an enormous number of facts and figures – that with a little bit of additional analysis can provide an even deeper understanding of the local economy.

A couple of weeks ago we published a blog explaining how to calculate and interpret an Industry Location Quotient, today we are going to go over another relatively simple technique to help understand how an industry is growing or declining in a particular region or local government area.
The technique is call Shift Share Analysis, which is simply a way of breaking the employment growth or decline in an industry into three components to help understand what is driving the change. These three change components are commonly know as;
National growth effect – the amount of growth or decline in an industry that could be attributed to the overall growth of the national economy.
Industry mix effect -the amount of growth or decline in an industry that could be attributed to the performance of the specific industry at the national level.
Regional competitive effect – the amount of growth or decline in a specific industry that could be attributed to a local advantage or disadvantage. This is generally the most interesting component as it clearly quantifies the level of advantage or disadvantage an industry has in the local area.
So how do you calculate a Shift Share Analysis?
We could provide you with the mathematical notation to calculate these components, however that would probably make what is a relatively simple calculation appear unnecessarily complex.
A better way to explain these calculations is via an example.
This example looks at the employment change in the ‘Professional, Scientific and Technical Services’ industry for the Sunshine Coast between 2006/7 and 2011/12. The % growth in total employment for Australia over this period was 9.8%. Over the same period % growth in employment for the Professional, Scientific and Technical Services industry for all of Australia was 19.5%, while the % growth in employment in the Professional, Scientific and Technical Services industry for the Sunshine Coast was 39.4%, increasing from 5,455 in 2006/7 to 7,602 in 2011/12. This translates to an additional 2,147 employees in the industry on the Sunshine Coast between 2006/7 and 2011/12.
Using this information, obtained from Sunshine Coast’s economy.id site, we can break the growth in this industry down into the Shift Share Analysis components.
National growth effect – This is derived by multiplying the level of employment in the first period (5,455) by the national growth rate (9.8%) giving an increase of 535 employees that using this method is attributed to overall growth of the national economy.
Industry mix effect – To calculate this we must first calculate the level of growth that could be assumed based on the national growth for the particular industry. This is derived by multiplying the level of employment in the first period (5,455) by the national growth rate in Professional, Scientific and Technical Services industry (19.5%), giving an increase of 1,063 employees. Then to create the Industry mix effect we must subtract the National growth effect (535) for this figure leaving 528 additional employees that can be attributed to the fact that the Professional, Scientific and Technical Services industry performance is better than the national economy performance overall.
Regional competitive effect – This is derived by subtracting the level of change assumed by the national growth rate in the industry (1,063 employees) away from the total change in the industry at the local level (2,147). This leaves an increase of 1084 employees in the Professional, Scientific and Technical Services industry in the Sunshine Coast that can be attributed to advantages the industry has in the local area.
What does this really mean for the Sunshine Coast economy?
Based just on employment and the growth rate, it is clear the Professional, Scientific and Technical Services industry is very important for the Sunshine Coast and Australia as a whole. The shift share analysis adds another layer to this by highlighting the significant local advantages for this industry in the Sunshine Coast. The 1,084 addition jobs over and above the national growth effect and industry mix effect shows that the local industry has a 50% local competitive advantage/specialisation compared to the rest of the nation on average.
How do I get this information out of an economy.id site?
All the information you need to do a shift share analysis can found on the ‘Industry focus’ page of Sunshine Coast’s economy.id tool http://economy.id.com.au/sunshine-coast/industry-sector-analysis . In this explanation I assume some knowledge of how to use economy.id sites.
To calculate all three Shift Share analysis components we first need to obtain or calculate the following values.
- % growth in total employment for Australia over the specified time period
- % growth in employment for the relevant industry for Australia over the specified time period
- % growth in employment for the relevant industry for the Sunshine Coast over the specified time period
- Total person employed in the relevant industry in the Sunshine Coast at the start of the specified time period.
Using the link above go to the ‘Industry sector analysis’ page for the Sunshine Coast and change the ‘Current benchmark’ to Australia. This will give you the following table.
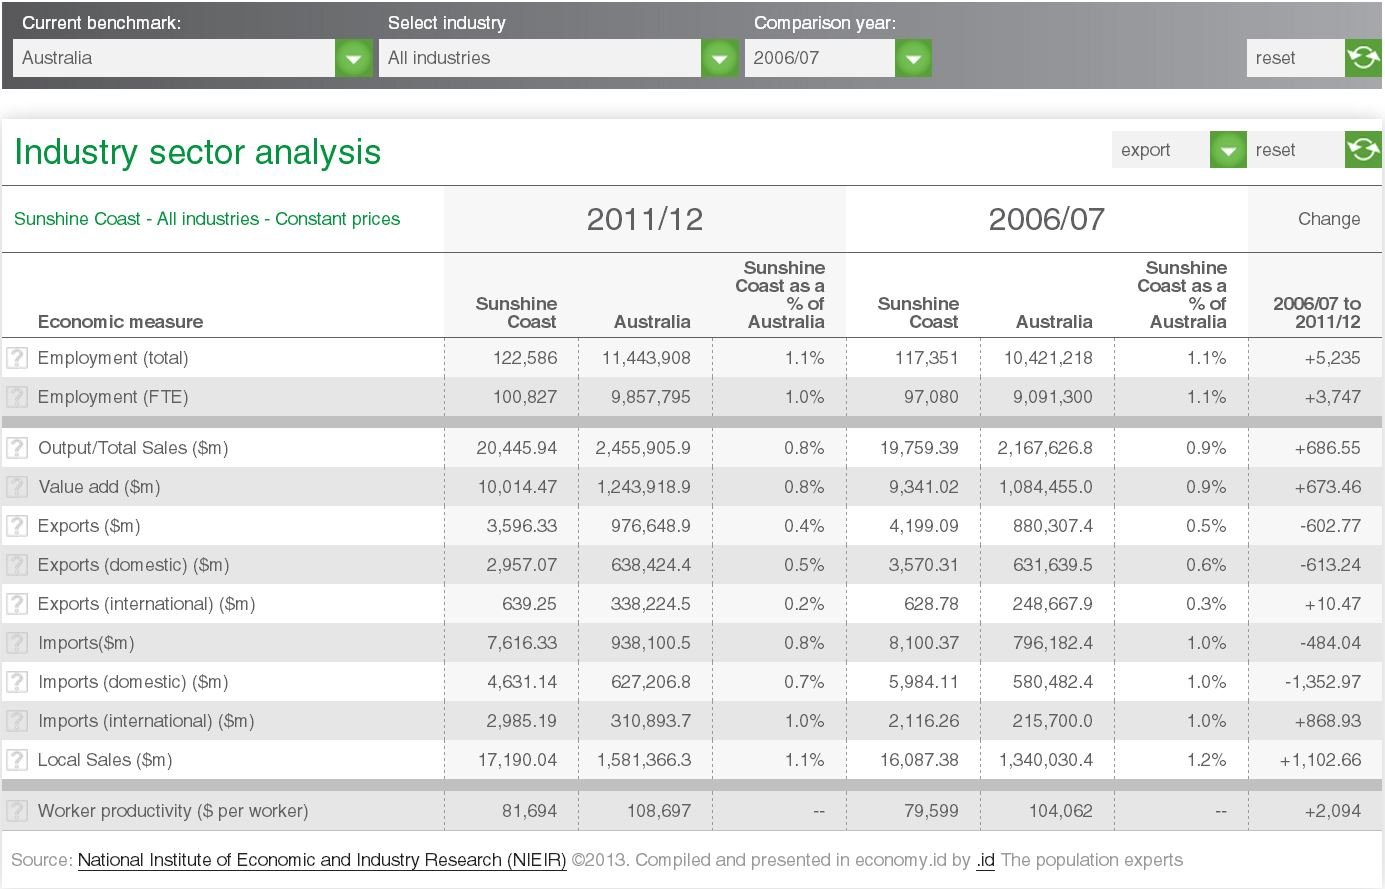
Step 1: Calculate % growth in total employment for Australia between 2006/7 and 2011/12
Calculation
- (figure 1 – figure 2)/ figure 2 * 100 = % growth in total employment for Australia
Example
- (11,443,908 – 10,421,218) /11,443,908 x 100 = 9.8% growth
To calculate the rest of the figures you will need to change the Selected industry from ‘All industries’ to ‘Professional, Scientific and Technical Services’ in the control panel. This will give you the following table.
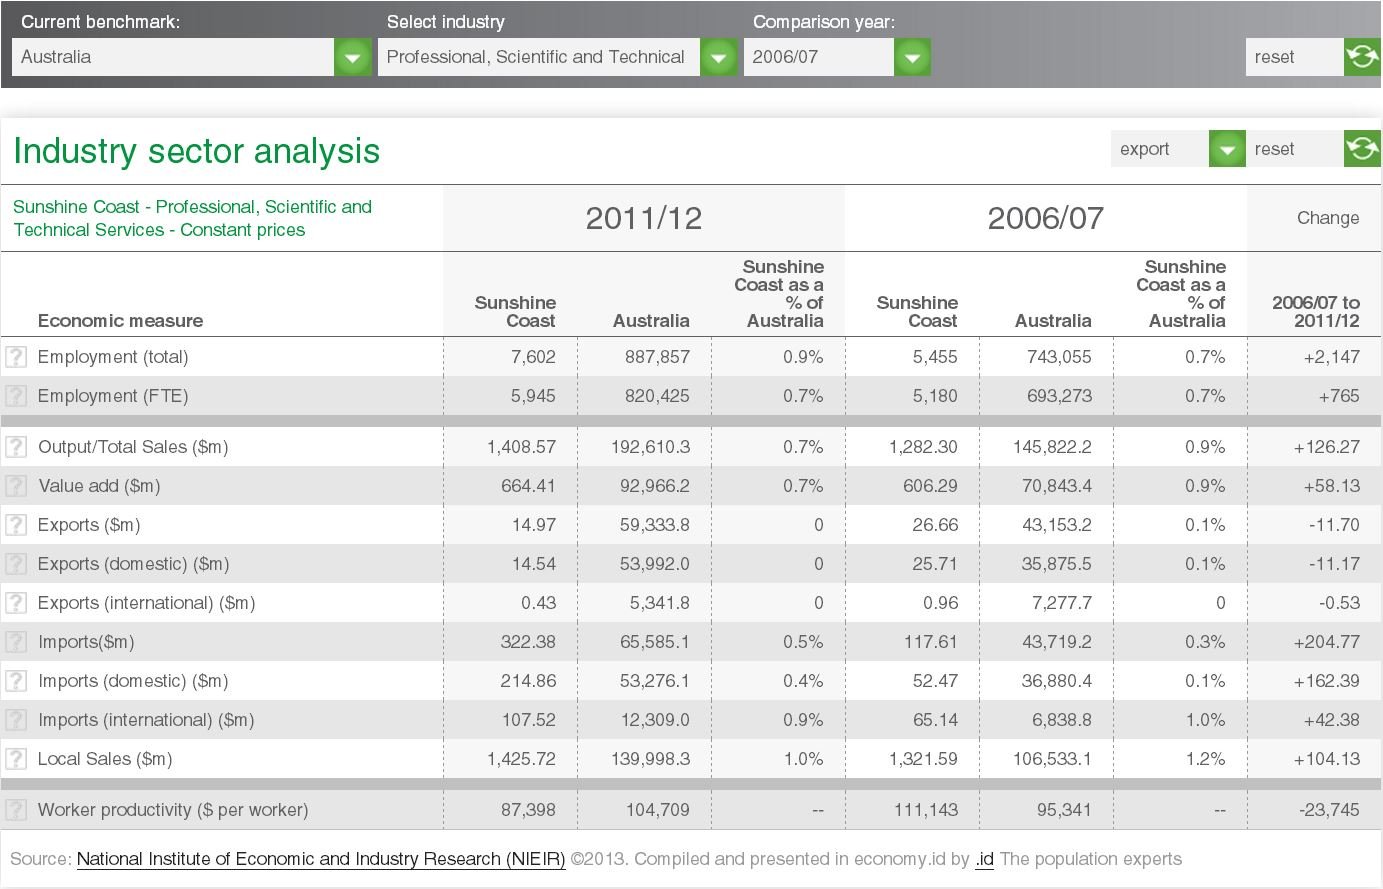
Step 2: Calculate % growth in employment in the Professional, Scientific and Technical Services industry for Australia
Calculation
- (figure 5 – figure 3)/ figure 5 * 100
Example
- (743,055 – 887,857) / 743,055 x 100 = 19.5% growth
Step 3: Calculate % growth in employment in the Professional, Scientific and Technical Services industry for the Sunshine Coast
Calculation
- figure 6/ figure 4 * 100
Example
- 2,147 / 5,455 x 100 = 39.4% growth
Step 4: Total persons employed in the Professional, Scientific and Technical Services industry in the Sunshine Coast in 2006/7
Figure 4 = 5,455 persons
Now you know how to find these figures you can recreate the example above for any industry in any area that subscribes to economy.id.
This analysis is especially useful for understanding what is happening in an industry that is growing locally but declining nationally (or the reverse).
Councils can benefit from the wealth of economic information in economy.id, which tells the story of your local economy. If you are interested in having a look at economy.id for your council, please drop us a line – info@id.com.au or (03) 9417 2205.

Lailani - Population News
Lailani is responsible for content and strategy at .id, ensuring our clients’ needs are central to our enterprise and that we generously share our knowledge with the broadest audience. As a member of our Board, Lailani works with Ivan and Janet to set the strategic direction for the company. Her current focus is our Placemaker consulting business and she has worked with numerous clients across retail, finance, property, local government, education and not-for-profits to put together the best evidence-base for their spatial decision making. With degrees in Business Studies and Economics, she has worked in business development and marketing roles for IBM and SPSS in the UK, as well as a stint as a ranger in Kakadu National Park. Lailani is an Alexander Technique practitioner, surfer and traveller.