Population change on the Gold Coast
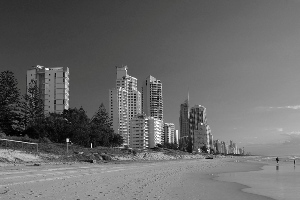
The Gold Coast is an interesting study in urban geography, especially in the Australian context, as its rise to prominence as a major urban area is a relatively recent phenomenon. It has moved well beyond its traditional role as a simply a tourism and retirement destination (though these are still important). I can’t think of anywhere else in Australia where the skyline looks as if it has been plucked straight out of Florida and plonked on our shores. It’s unique for its settlement pattern, its relatively short history, and its rapid growth. What population and housing trends can we observe?
Population growth and change
In recent decades, South East Queensland (SEQ) has been one of the fastest growing regions in Australia and this trend has largely been driven by the growth of the Gold Coast from a strip of coastal villages and towns into a 21st century urban region. Not only is this evident through population data, but the skyline has changed dramatically with more and more high rise apartments taking root on the narrow coastal strip. This is epitomised by the Q1 apartments – at 80 storeys it is the tallest residential tower in Australia. But it’s not just about this very visual urban change along the coast – the suburbs of the Gold Coast spread inland and, increasingly, in a northerly direction. Though it’s necessary to define areas statistically on the basis of administrative boundaries, the economic and cultural ties between the Gold Coast and Brisbane are such that, in combination with urban growth, the boundary between these two cities is becoming increasingly blurred.
The chart below shows how the population has grown in the last decade. Gold Coast City Council reached a population of 500,000 in 2009, and in 2011 the population was 513,954. Over the period 2001-2011, the population grew by one-third. However, this masks changes over this time period, as the growth rate has slowed in the last few years. At the same time, Queensland as a whole has recorded a decline in net interstate migration, which has traditionally been a major source of its population growth. As a major urban area, the Gold Coast will be affected by this trend. However, the evidence from the 2011 Census shows that the Gold Coast continues to gain people through migration in all age groups – a profile that is not common in Australia.
Source: ABS, Regional Population Growth (Cat. no. 3218.0)
The Gold Coast and its suburbs
Due to its size and development over the past few decades, population growth and change varies considerably across the City. The map below (click for a larger size) shows the average annual percentage change in the Small Areas that comprise the City over the period 2006 to 2011. Bright orange areas grew strongly, while those shaded mushroom recorded a decline in population. Yes – you read correctly – decline. Even on the Gold Coast. It’s now that big that it’s possible to observe changes that we normally associate with the suburbs of Melbourne, Sydney, Brisbane etc.

The fastest growing Small Areas were located in the north west of the City, where there are numerous greenfield development sites, generally following the highway as it heads north to Brisbane. Pimpana – Coomera had the distinctive of recording the fastest growth – 17.6% per annum on average – more than doubling its 2006 population. This was followed by Kingsholme – Upper Coomera (9.9%) and Hope Island (9.5%). The growth of Hope Island is driven by retirement migration, whereas young families are more prominent in Pimpana – Coomera and Kingsholme – Upper Coomera.
Areas that recorded population decline were generally located in the older parts of the Gold Coast and include Coolangatta (-0.5%) and Burleigh Heads (-0.2%). Both are well established parts of the Gold Coast with older populations and smaller households. They may well undergo suburban regeneration and subsequent population increase as these older households make way for young families in the future.
Dwelling stucture
The Gold Coast is famous for its skyline and high density development along its coastal strip. Dwelling structure data from the Census confirms a very different dwelling profile compared to the rest of the country, as shown in the chart below.
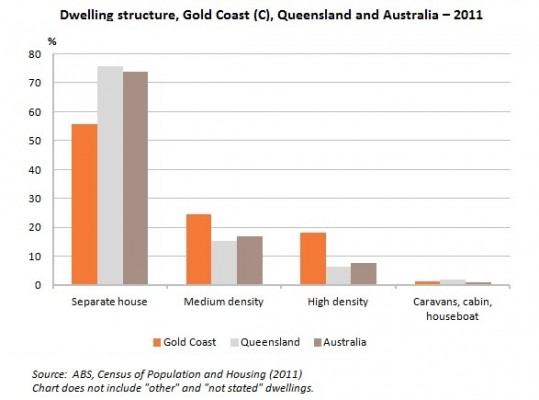
Clearly, the proportion of separate houses on the Gold Coast (56%) is much lower than that of Queensland (76%) and Australia (74%). Correspondingly, the proportion of medium and high density dwellings is much higher. Almost one quarter of dwellings on the Gold Coast are medium density, compared to 17% Australia wide. Medium density dwellings include townhouses, villa units as well as flats and apartments in blocks of one or two storeys. But it’s the high density dwellings (flats and apartments in blocks of three or more storeys) that typify the Gold Coast, and these comprise 18% of dwellings, compared to 8% in Australia and 7% in Queensland.
The statistics presented here were taken from the Gold Coast City Council’s Community Profile. Click on the link to see what other characteristics were revealed in the 2011 Census.
Access the Australian Community Profile to find Census results for each Capital City, State, Southeast Queensland and Australia on topics including population, age, country of birth, languages spoken, occupations, industries, employment, disability, income, qualifications, transport and much more…
Access the new profile.id sites and other population statistics for Local Government Areas and suburbs at .id’s demographic resource centre.
Simone - Myth Buster
Simone has a rich background in human geography, demography and urban planning – a background that was useful in her previous roles in the Commonwealth and State Governments, and now as part of the forecast team at .id. From the Queensland coast to the southern suburbs of Perth, Simone produces population and dwelling forecasts that help local governments make informed decisions about future service and planning needs. She is a regular contributor to .id’s blog and has spoken at several conferences on how our cities and regions are changing. She is a big advocate of evidence-based planning and how Census and other data can inform this. Outside of work Simone is a keen traveller and photographer – interests that tie in well with her professional life and help her to understand “place”.


