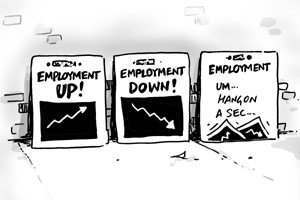
What’s with all these different employment figures?
I was recently asked by one of .id’s clients as to why there was a difference between the employment figures produced by the Census, and those produced by the Dept of Employment, Education and Workplace Relations (DEEWR) in their Small Area Labour Markets publication. The answer is a relatively straightforward one – and I’ll elaborate below – but it did make me think that there are a lot of different employment statistics floating around, and that other readers may be interested in what’s available, what the data says, and what the difference is between the collections. We even use a range of different employment statistics in our own products. Read on….
Labour force data from the Census
There are a number of questions on the Census form that are used to produce labour force statistics. These include employment status ie employed or unemployment, hours worked, unpaid work, as well as the very detailed data on industry and occupation. The important thing to note about the Census is that it is self-reported ie what respondents put on the form, which is then processed centrally. We include a lot of Census based labour force data in our products – most notably profile.id and economy.id. As we’ve blogged previously, profile.id has recently been updated with 2011 Census data, including the second release which contains the labour force data.
It’s also important to note that different employment counts are available from the Census – one based on where you live (enumerated and usual residence) and the other based on where you work. So if you want to know where doctors live – use the first count, but if you want to know where they work – use the second.
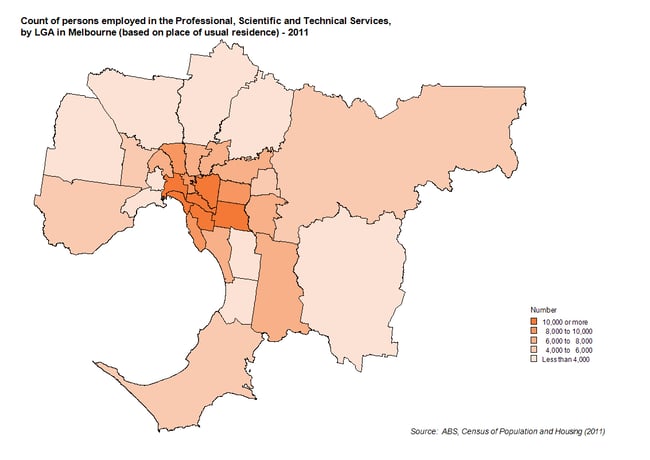
What I like most about labour force data from the Census is its ability to tell interesting spatial stories. The map below shows the number of people employed in the Professional, Technical and Scientific industry in Melbourne’s LGAs in 2011. Many of the jobs in this industry require a qualification and they are highly paid. Clearly there is a concentration of people employed in this industry living in Melbourne’s inner and inner south east. It’s a simple map but it tells an effective story.
ABS Labour Force Survey
The monthly labour force survey is one of the longest running surveys conducted by the ABS. It is based on a sample of households selected randomly across Australia. The figures produced by this survey are a major economic indicator and are widely quoted – these are generally the figures you see reported in the newspapers or on TV. As a survey, the data is collected by trained interviewers who code respondents answers at the time. However because it is a survey, when the data is broken down into smaller geographic regions or cross tabulated multiple ways it introduces increasing amounts of standard error. The ABS does produce labour force statistics for sub-State areas – in the new geographical classification, the ASGS, the dissemination region is SA4. There are 106 of these across Australia, so the data is relatively rich and produced on a frequent basis.
Data from the Labour Force Survey is typically output in the publication Labour Force, Australia (Cat.no. 6202.0). The ABS also recently put together an article that looks at how to use labour force statistics, which is a good basis for inexperienced users. Some of the time series charts are very revealing in terms of how they depict societal change over the last 50 years, such as the increasing participation of women in the workforce.
Other ABS Labour Force data
The ABS produces a number of other labour force related collections, many of which are conducted as a supplement the monthly labour force survey. Some of this data may be available at SA4 level, depending on the sample size and standard errors. Some of them are excellent complements to the Census, in that they explore and collect data on themes not possible through that collection vehicle. Examples of these data include:
- Labour mobility, Australia (Cat.no. 6209.0) – data on people changing jobs;
- Retirement and retirement intentions (Cat.no. 6238.0) – self explanatory, but looks at those aged 45 years and over;
- Underemployed workers, Australia (Cat. no. 6265.0) – data on underutilised labour – also useful in exploding the myth that part time work = underemployment!
DEEWR Small Area Labour Markets data
However, many people are interested in data for small areas such as LGAs and this is where the Small Area Labour Markets (SALM) data fills an important gap. This collection has been running for some years and is published quarterly on the DEEWR website. The SPREE methodology (Structure Preserving Estimation) is used for this dataset. This takes the ABS Labour Force Survey but also incorporates Centrelink and Census data to enable estimates to be produced for smaller geographic areas. Historically, SALM has been produced for Statistical Local Areas – however as we know – these are no longer part of the new ABS geography so presumably they will need to move to another geographic output unit.
Employment forecasts
Compared to population forecasting, very little work appears to have been done in terms of forecasting future employment in Australia. The ABS has released data in the past, but this appears to have gone by the wayside. However, DEEWR do produce a series of employment projections on an annual basis. This includes a lot of data, including regions (Labour Markets), industry, occupation and skill level.
Other surveys and data collections
There are a wide variety of surveys, studies and data collections conducted by State governments, major financial institutions and academia. They are generally only available at the national level, or maybe States and Territories, and given the large number, I will only touch on a couple here. The ANZ Job advertisements series is produced monthly and measures jobs advertised in major daily newspapers and Internet sites in Australia’s captial cities. The Westpac-Melbourne Institue Survey of Consumer Unemployment Expectations isn’t so much about actual rates, but rather what respondents expect unemployment to be like in the next twelve months.
Differences in methodology produce different results
The wide variety of labour force statistics available can be overwhelming, particularly if you see employment figures which appear to be measuring the same thing. But are they? If I can refer back to the question from our client, why are the employment figures produced by the Census and the SALM different? Well, it basically comes back to the methodology, and the oft used apples and pears comparison. In this case, the Census figures are just that, but the SALM data is modelled (yet still incorporates Census data). More often than not, what appears to be a figure measuring the same thing isn’t, but it does involve an understanding as to what is being measured and how it has been produced. On .id’s website we do included methodological notes to assist our users in understanding the data, so it’s always a good first point of call (though we don’t mind answering your questions either!).
Access the Australian Community Profile now!
Access the new profile.id sites and other population statistics for Australia, States, Capital Cities, Local Government Areas and suburbs at .id’s demographic resource centre.
![]()
Simone - Myth Buster
Simone has a rich background in human geography, demography and urban planning – a background that was useful in her previous roles in the Commonwealth and State Governments, and now as part of the forecast team at .id. From the Queensland coast to the southern suburbs of Perth, Simone produces population and dwelling forecasts that help local governments make informed decisions about future service and planning needs. She is a regular contributor to .id’s blog and has spoken at several conferences on how our cities and regions are changing. She is a big advocate of evidence-based planning and how Census and other data can inform this. Outside of work Simone is a keen traveller and photographer – interests that tie in well with her professional life and help her to understand “place”.


