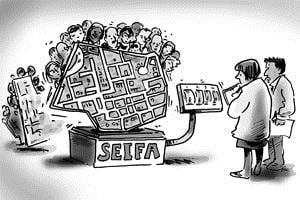
On March 28th, the day before Easter, the ABS released the final dataset derived from the 2011 Census, the Socio-Economic Indexes for Areas. Some people may know this better as the “Index of Disadvantage” because that’s the most widely used one, and the one we present on profile.id and atlas.id. However, there are actually 4 indexes, which each have slightly different uses. Though commonly used, SEIFA is also quite misunderstood, and there is also some stigma attached to having a low SEIFA score. This blog goes through what SEIFA is, and briefly what the new dataset shows.

What is SEIFA?
SEIFA, or Socio-Economic Indexes for Areas, is a number, or series of 4 numbers, which describe the relative level of socio-economic advantage or disadvantage in an area. Advantage is defined in terms of “access to material and social resources and ability to participate in society”. Australia’s index is set up so that lower numbers are more disadvantaged, and higher numbers are less disadvantaged. New Zealand’s equivalent index is the opposite. The index is designed so that the national average sits around 1,000.
What do we mean by disadvantage? Well it includes a number of characteristics, all derived from the Census, and the actual characteristics used change each Census (which is one reason that comparison over time isn’t recommended). To get a low SEIFA score, an area might have a high unemployment rate, low incomes, a high proportion of people with poor English proficiency, many people without qualifications, a high rate of single parent families, etc.
What indexes are there?
SEIFA consists of 4 indexes:
- Index of Disadvantage
- Index of Advantage/Disadvantage
- Index of Economic resources
- Index of Education and Occupation
Of these, by far the most commonly used is the index of disadvantage. It is used to measure the level of disadvantage in an area, but a high number on the index (remember lower means more disadvantaged) doesn’t necessarily imply a high level of ADVANTAGE, but merely a LACK OF DISADVANTAGE, which is subtly different. The second index, the Index of Advantage/Disadvantage, measures both ends of the scale at once, and so is more symmetrical around 1,000, with the index scores going much higher.
What areas is it available for?
SEIFA indexes are available from the ABS for any area for which Census data can be derived. The only exceptions are a few small districts with very unusual population characteristics, which are excluded from the index. For example, areas with a high proportion of population in non-private dwellings such as hospitals and boarding schools.
On profile.id, the Index of Disadvantage is presented for each suburb/district in your area, with comparisons to all the benchmarks available on the site. Atlas.id maps SEIFA across your area.
Who uses it?
SEIFA is widely used by state and federal governments, and other agencies looking at ranking areas and targeting services to the most disadvantaged. When you are dealing with a range of areas and need to allocate scarce resources to those communities likely to need it most, it is invaluable to be able to sort areas based on a range of characteristics into one list.
However, if you are working with these communities every day, SEIFA probably doesn’t tell you much that you don’t already know. In terms of understanding the disadvantage in a particular community, the raw Census data in profile.id may be more useful. For instance, is a low SEIFA score simply due to an elderly population mainly on low incomes (pensions)? Or is it due to a high non-English speaking population, who actually form a coherent and tight-knit community? These are questions for which you need to look a bit deeper than one number.
A few points to remember
- The SEIFA data isn’t actually new – it only uses Census data you’ve already had access to on profile.id for many months! It simply puts it in a form which is accessible as a single number.
- If you need to apply for a grant or advocate for your community with a higher level of government, it is likely that you will need a SEIFA index, and may specifically be asked to include it in your submission. Make sure you distinguish between your LGA level SEIFA score and the specific one for the suburb or district you’re looking at. The larger you go, the more average the score becomes.
- It’s tempting to compare over time, but try to avoid it. The SEIFA scores aren’t directly comparable over time, because the analysis may use slightly different variables and weightings from one Census to the next. It is possible to some extent to compare where your area sits compared to nearby areas in a ranked list, however.
- SEIFA says nothing about individuals living in a community. It ranks AREAS, and you can have high income, highly educated individuals living in low SEIFA areas, and vice-versa. The SEIFA score of the place you live in implies nothing about you personally!
Here is a link to the 2011 SEIFA data on the ABS website.
2011 SEIFA data is now live on profile.id and atlas.id. Atlas.id now features two maps, one showing the index of disadvantage and one showing the index of advantage/disadvantage.
Access the Australian Community Profile now. You will find Census results (including SEIFA data) for each Capital City, State, Southeast Queensland and Australia on topics including population, age, country of birth, languages spoken, occupations, industries, employment, disability, income, qualifications, transport and much more…


