How to get the most out of your social atlas
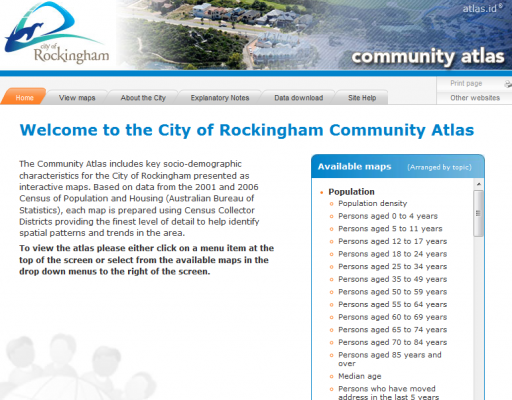
Most councils who subscribe to profile.id also have atlas.id. The online social atlas contains over 70 maps which allow you to see how different population groups are distributed across your LGA. But atlas.id is more than just maps. It is also the easiest way compare results for each suburb and your benchmark areas as well. Read on to find out how.
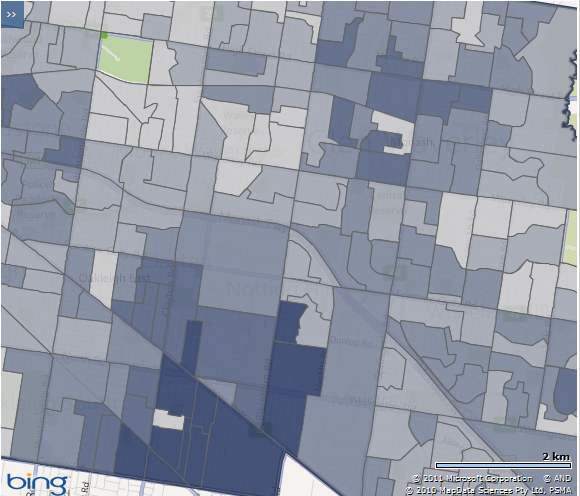
When you first go into atlas.id, you get a list of maps on the right hand side. Pick one of these, and the base map will load. Here is an example from the City of Rockingham, WA.
You can then change maps by using the drop-down menus at the top of the page. It is quicker to change maps from here rather than go back to the home page, because the base map doesn’t have to reload. Here, we’ve selected the “0-4 year olds” map for Rockingham.
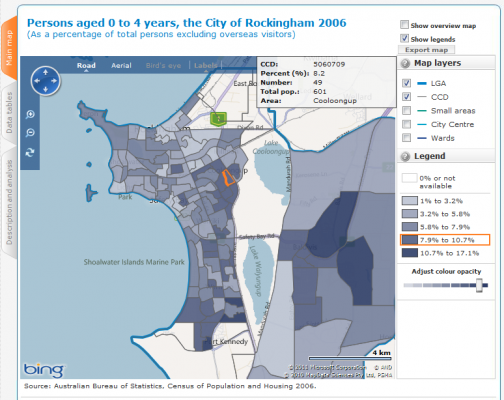
As you hover over each part of the map, the relevant Census Collection District (CD) lights up and gives you details of the population characteristic you’re looking at within that small boundary. You can zoom right into the few streets that make up the CD and relate the data to what’s on the ground. But what if you want to know the characteristic for the whole suburb of Cooloongup, which is made up of multiple CDs? It’s not effective to have roll over each CCD individually …. so….
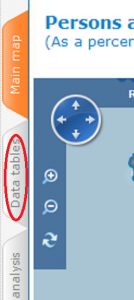
Sitting behind the map are some helpful tables which will provide you with this information. To access them, go to the ‘data tables tab’ which you will find to the left of the map.
 Data tables gives you a list of every small area (based on the small areas in profile.id – usually suburbs) and their number and percentage of the characteristic you’re looking at – in this case, population aged 0-4. So you can not only access data for the suburb you’re viewing on the map, but all suburbs in the LGA. This enables you to see at a glance the variability of that characteristic over your LGA.
It shows, in the case of Rockingham, Secret Harbour may not be so much of a secret to families with children – it has the highest proportion of 0-4 year olds in the LGA, at 10.1%.
Scroll down to the bottom of the left pane to see all the benchmarks for the LGA – enabling easy comparison of each small area to the benchmark(s).
(Those who have used “Data Download” in profile.id will realise that you can do this through that means as well, but for the characteristics available in the atlas, this is an easier way).
Once you are in the table page, there is an “Export to CSV” button at the bottom which loads the data into a flat file and (if you have MS Office installed) normally loads directly into Excel.
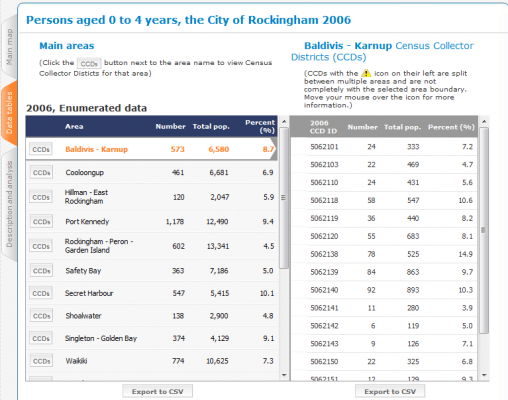
If you click on the “CCDs” button, the individual Census Collection District details from the selected small area load into the right-hand pane and can be exported as well. This is probably only of use if you want to export them into a GIS, as the CCD codes don’t mean anything without the associated map.
By now you may also have noticed the third tab “Description and Analysis”, below Data Tables. This gives you the background to the topic, what Census question it derives from, and a ranking of the top 3-5 areas for that characteristic in your area.
atlas.id is delivered to each council as a public website. For a list of all available atlas.id sites, please see our client list.
Did you find this tip helpful? Leave us a comment and let us know if you have any other suggestions for “how to” topics.
.id is a team of demographers, population forecasters, spatial planners, urban economists, and data experts who use a unique combination of online tools and consulting to help governments and organisations understand their local areas. Access our free demographic resources here
Glenn Capuano - Census Expert
Glenn is our resident Census expert. After ten years working at the ABS, Glenn's deep knowledge of the Census has been a crucial input in the development of our community profiles. These tools help everyday people uncover the rich and important stories about our communities that are often hidden deep in the Census data. Glenn is also our most prolific blogger - if you're reading this, you've just finished reading one of his blogs. Take a quick look at the front page of our blog and you'll no doubt find more of Glenn's latest work. As a client manager, Glenn travels the country giving sought-after briefings to councils and communities (these are also great opportunities for Glenn to tend to his rankings in Geolocation games such as Munzee and Geocaching).