My previous article on immigration looked at the national picture of emerging settlement groups, which arises from the data available on the Department of Immigration and Citizenship website. But information at the local level is also available, and very important for planning service delivery. My next few articles will each focus on a particular state, and the characteristics of recent migration in that state. To kick off, New South Wales, which had the largest number of permanent settler arrivals between 2006 and 2011 – 252,000 of them, or 30% of the national total. Who are they and where did they settle?
.jpg?width=300&height=199&name=sydney1%20(1).jpg)
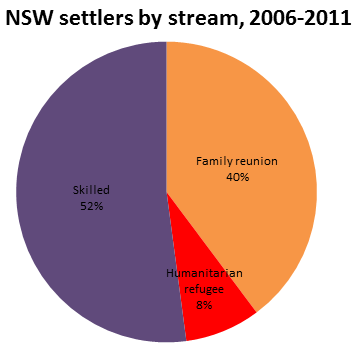
The breakdown of NSW arrivals by the three main settlement streams shows that 52% of the settlers arrived in the skilled migration stream. Another 40% were family reunion migrants – a number well above any other state. The remaining 8% (about 19,000 people) were humanitarian migrants, including refugees.

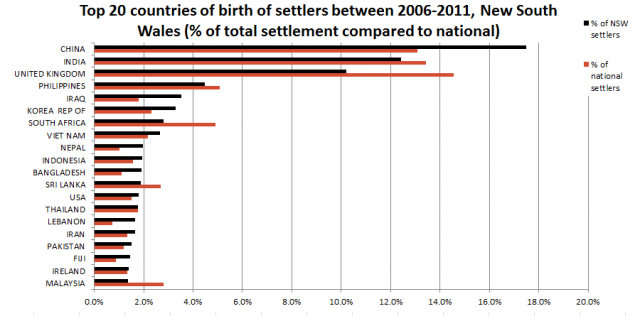
NSW migrants came from a greater variety of countries than any other state, with 223 different nations represented. Compared to the national trend, NSW gets far less migration from the UK and more from China. India is the second largest source of new settlers in NSW, but the percentage was actually lower than the national figure (12.4% compared to 13.4%).
Other countries with disproportionately more settlers in NSW than the national picture include Iraq, Korea, Vietnam, Nepal, Fiji and Lebanon. Though the large wave of Lebanese migration ended many years ago, significant numbers still arrive from Lebanon under the family reunion program and most settle in NSW. Among the smaller groups, NSW had more than half the national settlement from Syria, Jordan, Sierra Leone and Tonga.
Notably missing from the NSW migration numbers, with far lower than the national share include people from Malaysia (only 15% of the national total), South Africa (17%), the UK (21%). While it gets a large share of middle-eastern migration, NSW has a much lower share of African migration, accounting for only a small portion of national settlement from places like Zimbabwe (17%), Somalia (12%), Ethiopia (13%), DR Congo (16%) and Tanzania (15%), as well as emerging group Burma in SE Asia (16%).

So where in NSW are these migrants settling? The lions share of migrants arriving in Sydney settle in those diverse areas of Western Sydney which already have large overseas-born populations.
The largest number of settler arrivals went to Parramatta (14,073 people), followed by Blacktown. City of Sydney, Fairfield and Canterbury. The countries of origin arriving in these areas are as follows:
- The City of Parramatta (14,073) – An increase of nearly 5,000 people from India alone. When combined with those on student visas, this should double Parramatta’s already large Indian population in the 2011 Census. Also significant numbers from China (2,523), Sri Lanka, Lebanon, Korea and Iran. Most arrivals in Parramatta come in under the skilled migration and family streams.
- The City of Blacktown (13,425) – India is again the largest source country (3,487), closely followed by the Philippines (2,450). Blacktown already has a large and vibrant Filipino community – the largest in Australia. Other arrivals of note include Fiji (667), Pakistan (684) and Sudan (392). Blacktown also has the largest number of migrants from Bhutan, arriving in NSW (159 people). Blacktown has a large share of the humanitarian migration stream.
- The City of Sydney‘s (13,303) migration profile looks quite different to Western Sydney. China (2,792) is the dominant group, and there is also large migration from the UK (1,948). Asian countries (Indonesia, Thailand, Korea, Malaysia) make up most of the rest. The vast majority of the City of Sydney’s migrants come in through the skilled migration stream, with very few humanitarian migrants.
- The City of Fairfield (10,365) – Most of the migrants here are building on existing populations, such as the large Assyrian community. Iraq was the main country of birth, with 3,999 people, or over 25% of all arrivals from Iraq in Australia. Most of these are humanitarian refugees. The next largest was from Vietnam – almost all family reunion arrivals joining the largest Vietnamese community in Australia in Cabramatta. Other large groups in Fairfield include Cambodia and China.
- The City of Canterbury – One of the traditional first ports of call for migrants in Australia – The largest number of settlers came from China (2,458), followed by Bangladesh (1,379). Other countries in the subcontinent, Pakistan (578) and India (968) also feature highly here, as well as Lebanon, Indonesia, Vietnam, Nepal and Korea. Canterbury is one of the most diverse areas in NSW, and there were 23 countries with more than 50 arrivals over 5 years.
Also worth mentioning are the LGAs of:
- Auburn (China, India, Afghanistan)
- Holroyd (India, Sri Lanka)
- Liverpool (Iraq, India, Fiji)
- Randwick (China, UK, Indonesia, Ireland)
- Hornsby (China, India, Korea)
- Ryde (China, India, Korea)
- Hurstville (China)
To view comprehensive community profiles of these areas, click here.
While most of the migration is going into Sydney, particularly Western Sydney, there are also significant numbers in some regional areas. Some regional cities have been the specific focus of humanitarian migration, so they have some of the emerging smaller population groups which are not present in Sydney. Examples include:
- Albury (India, Bhutan, Nepal)
- Wagga Wagga (India, China, Sudan, Burma)
- Coffs Harbour (UK, India, Burma, Sudan)
- Queanbeyan (India, Philippines, China)
- Griffith (India, Philippines, Afghanistan)
Once the 2011 Census data is released we will get information on all these communities at the local suburb level, and our profile.id subscribers will be able to access information on population change back to 1991, and the full list of over 100 countries of birth for their areas. It will also reveal whether most migrants stay where they initially settle or move substantially into new areas.
.id is a team of demographers, population forecasters, spatial planners, urban economists, and data experts who use a unique combination of online tools and consulting to help governments and organisations understand their local areas. Access our free demographic resources here

.jpg?width=300&height=199&name=sydney1%20(1).jpg)


