Earlier this year the ABS released their 2012 population estimates for local government areas across Australia (Regional Population Growth, ABS Cat. no. 3218.0). This gives us the first glimpse into post 2011 Census population trends for smaller geographic levels. Australia continues to record high volumes of population growth, but what is happening locally? This blog will examine population growth trends in the Melbourne metropolitan area over the period 2011-12.

Melbourne’s population in 2012
At June 2012, the population of the Melbourne metropolitan area (defined as the 31 metropolitan LGAs) reached 4.18 million, up from 4.11 million the year before. This represents a growth rate of 1.8% over the twelve months, slightly above the Australian figure of 1.4%. The rate and volume of population growth is still very high from a historical perspective, especially when compared to the 1980s and 1990s.
A sense of deja vu
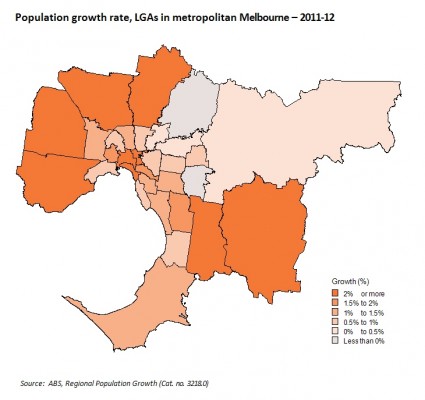
As I write this analysis, I feel like I could have almost written the same thing for the past six years or so. As the map below shows (click for a larger version), Melbourne’s strongest growth is still occurring on the urban fringe – particularly the so-called growth area councils – and the inner core. Once again, the City of Wyndham takes the prize for recording both the strongest rate of growth (7.6%) and highest volume of growth (12,649 people) in Melbourne over the twelve months ended June 2012. Such is the pace of growth in Wyndham that it continues to be one of the fastest growing areas in Australia – only Serpentine-Jarrahdale Shire, a small municipality on Perth’s south eastern outskirts, recorded more rapid growth than Wyndham in 2011-12.

One of the more remarkable aspects of Melbourne’s population growth is the VERY high rates recorded. Aside from Wyndham, three other councils recorded growth rates of more than 5% – Cardinia (5.6%), Whittlesea (5.4%) and Melbourne (5.1%). This means that growth does tend to be a bit more concentrated – after all, when you look at the map, most areas recorded fairly modest growth rates. In fact, six councils accounted for just over half of the 2011-12 population growth in metropolitan Melbourne – aside from those mentioned above, the others were Melton and Port Phillip.
Growth (kind of slowing) in Melton
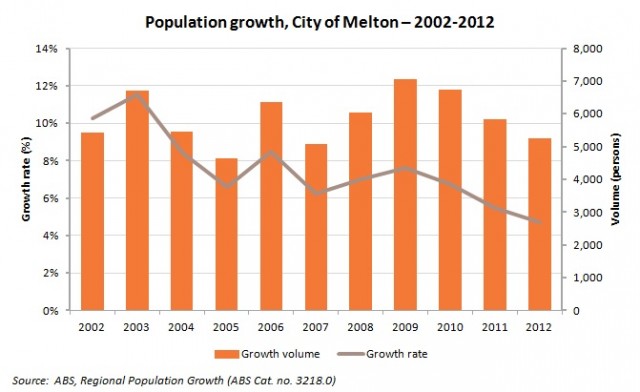
The experience of the City of Melton is an interesting one. For so long Wyndham’s partner in the high growth rate stakes, the City “only” recorded growth of 4.7% in 2011-12. Although population growth rates do tend to decline as populations increase, Melton’s growth rate has been trending downward for the last few years – it was above 10% in the early part of the 2000s, and a rate of 7.6% was recorded as recently as 2008-09. Nevertheless, 4.7% still translates into growth over 5,252 people, and when the volume of growth is considered, it’s comparable to levels recorded over the last ten or so years. This is shown in the graph below. Of course, this may change in the future as residential land supply associated with the Toolern development comes onto the market.

But not everywhere is growing – the household life cycle strikes again!
The general trend since 2006 is for all metropolitan Melbourne councils to record growth, but Nillumbik Shire Council has recorded small levels of population decline for the past three years. In 2011-12 this amount to a decrease of just 92 people or -0.1% growth. Knox City Council is another member of the negative growth club, but again, the amounts are small – a decrease of 42 persons in 2011-12, or -0.03%. The reasons behind this are different – Nillumbik was impacted by the 2009 Black Saturday bushfires which destroyed many houses in the northern part of the municipality and this may have played a part initially, but the Shire has long recorded modest levels of housing development due to topographical and planning constraints. This, coupled with an ageing population, particularly of families, is resulting in the creation of smaller households, particularly in areas that were largely developed in the 1980s and 1990s. This is the most likely explanation for the declining population in Knox, as the supply of greenfield land is basically exhausted after many years of suburban development and households are slowly ageing. We’ve talked about the impact of the household life cycle and suburban regeneration before, but it really becomes apparent in areas with stable and ageing populations such as Nillumbik and Knox. Over time, these older households will make way for younger households, potentially starting a new wave of population growth.
But wait – will the demographic story change?
Much as these new set of population figures tell a story, they aren’t the final numbers. As previously blogged, the ABS will be releasing the final ERP estimates for 2011 in late August – the likely impact is that the numbers will change, but the overall trends won’t. Of greater interest, and potential impact, is the revision of ERP estimates for LGAs back to 2001 (unfortunately not back to 1991 as with SA2s). These changes have been necessitated by the new methodology employed for calculating the Census undercount in 2011, and the questions it raised as to the accuracy of these calculations in previous Censuses, and their subsequent impact on the ERP. We’ll need to wait and see, but hopefully I won’t have to write all this again!
Access our online demographic resource centre for more population and demographic information about your area. You may also wish to subscribe to our blog or monthly newsletter to receive the latest updates about Australia’s ever-changing population and demography. Or visit our website to learn about about .id the population experts and our population forecasting services.


