Over the years I’ve heard many people from local government excuse their lack of interest in population forecasts by blaming it on a lack of growth in their municipality. “Why do we need to know about our future population when there’s no growth?” is a common lament. It seems that if there’s no visual evidence of population growth, then there’s an assumption (‘cuse the pun!) that there is no need to plan for future population needs. Or is there? While it’s true that the overwhelming majority of .id’s forecasts prepared for local councils do assume growth, a closer look reveals that it’s not all chocolates and roses – many small areas have relatively stable or declining populations. And just because the total population of a municipality might be stable or declining, this often masks considerable change at more local levels of geography. Let’s have a look at some examples.
.jpg?width=300&height=200&name=do-we-need-forecast%20(1).jpg)
Growth and change in Adelaide’s eastern suburbs – City of Burnside
One of the slower growth councils on .id’s client list is the City of Burnside, located in Adelaide’s eastern suburbs. Between 2006 and 2011, the ERP increased by just 244, to reach of population of 44,040 in 2011. This translates to an annual average growth rate of just 0.1%. Future growth rates out to 2031 are assumed to occur at a similar rate. Despite its proximity to the Adelaide CBD, there are a number of contraints on future development, including character and heritage overlays, and an overall lack of strategic development sites. Very modest growth is assumed in most small areas, but many areas are assumed to decline in population, mainly through the natural process of household ageing. The overwhelming bulk of growth is assumed in Glenside – Eastwood where there are strategic development sites, most notably the former Glenside Hospital. This mixed use development is assumed to be attractive to young adults seeking accommodation close to the CBD.
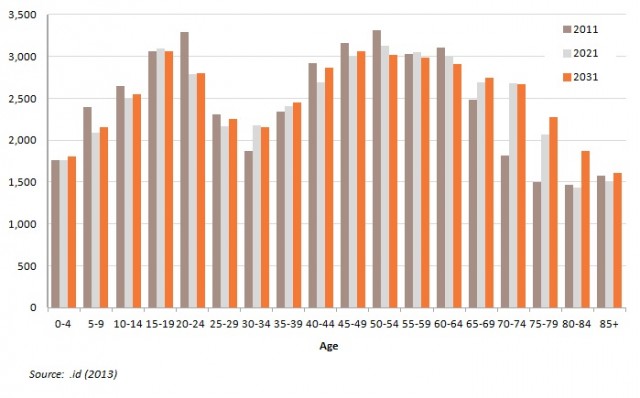
Overall however the lack of housing development opportunities and the maturing of existing households results in a much older age profile by 2031, as shown in the graph below. Currently, the age profile is dominated by mature families, many of whom take advantage of access to Adelaide’s premier private schools. However, over time, these households mature and the children move out to form their own households. By 2021 the population aged 70 years and over increases considerably, and this trend continues to 2031. Clearly this will place additional pressure on services for the elderly, including aged care and health.

and the City of Tea Tree Gully
Tea Tree Gully is located in Adelaide’s north east and was primarily developed for housing in the 1970s and 1980s. The population grew steadily up until the early part of the 2000s, on the back of new housing that was popular with young families. The table below shows that since the first half of the 2000s, the population has started to decline. This is primarily a result of a diminishing supply of greenfield sites which are now confined to the northern part of the City. However maturing households and the out-migration of young adults – who 20 years ago were part of the influx of young families to the area – also plays a role.
Source: ABS, Regional Population Growth (Cat. no. 3218.0) and .id
Population forecasts prepared by .id assume a moderate level of change in Tea Tree Gully over the next 20 years. While existing trends of out-migration of young adults and ageing households continue in the short term, eventually the processes of suburban regeneration, coupled with additional supply being made available in Highbury towards the end of this decade, put an end to population decline. By 2021, the population of Tea Tree Gully is forecast to be at its 2006 level, and is assumed to increase thereafter.
Rural areas in decline – Shire of Campaspe
The Shire of Campaspe is located in Victoria’s north and is centred on the Murray River town of Echuca. While the town itself has recorded steady growth over the last ten years, the same cannot be said of the surrounding rural areas. This has resulted in a Shire population that has remained fairly stable since 2001 with periods of growth and decline over this time. The processes of population decline in rural Australia are well documented and have been occurring over many decades. It is primarily the result of reduced labour requirements on farms, out-migration of young adults, and ageing of the population.
The bulk of population growth between 2011 and 2031 is assumed to occur to the west of the existing township of Echuca (the small area of Echuca – West) building on the greenfield development that has been occurring here over the last decade and where a number of future sites have been identified. These greenfield areas are slightly different to those in metropolitan areas, in that they are also popular with retirees, resulting in a more mature age profile.
This contrasts with the small area of Rushworth & District, located in the southern part of the Shire and which is largely rural in nature. Unsurprisingly, there are no development sites identified here so any dwelling growth will occur as a result of demand, which is assumed to be low. Coupled with the out-migration of young adults, this results in a ageing population profile with most growth at the upper end of the age spectrum, as shown in the graph below. For many rural councils, it remains a considerable challenge to provide services to their elderly residents in sparsely populated areas, and given current demographic trends, one that is unlikely to go away.
A link to the Shire of Campaspe’s forecast is here.
The importance of geography
I know I go on a bit about the importance of geography, but I really can’t say it enough! Local councils are diverse places and there can be considerable spatial differences in demographic trends. Areas with stable populations have considerable internal churn as the above examples show. Our cities and towns evolve over time and in different ways from a spatial perspective, and it’s critical for planners to have an understanding of the drivers behind this. When .id prepares forecasts for local councils, we employ a “bottom up” approach which allows users to see how current and future population trends differ across a municipality. We believe this approach allows councils to make informed decisions with regard to future service planning requirements at the local area level.
Access our online demographic resource centre for more population forecasts of local government areas.


.jpg?width=300&height=200&name=do-we-need-forecast%20(1).jpg)


.png)


