The economic data modelling in economy.id, done by National Economics, is a sophisticated micro-simulation model of your local economy, and is updated every year. We have just loaded a new dataset, complete to the end of the 2011-12 financial year onto economy.id. But it’s not just the latest year’s data which has been updated, the data is now even more sensitive to local factors and variations.

Economic data is not generally available for local areas such as sub-State regions or Local Government Areas. Economic modellers have the challenging task of taking national and state figures and modelling them down to these smaller geographic areas. Their task is to create an economic model that is the most accurate representation of economic reality that we can have.
National Economics (NIEIR) are .id’s economic modellers of choice. We believe that their model is the most sophisticated and nuanced for local areas. NIEIR are continually refining and improving their economic model, which forms a large part of economy.id, and with the latest data release, a number of improvements have been made to ensure that the model is an even better representation of local economic reality.
What has been updated?
The datasets which have been updated are:
- Gross Regional Product
- Unemployment
- Building Approvals
- Local productivity
- Worker productivity
- Household productivity (disposable income)
- Employment by industry
- FTE employment by industry
- Industry Value-Added
- Industry sector profiles (sales, output, imports, exports etc.)
- Household expenditure
All these datasets now form a continuous time series for your area and benchmarks, from the 1998-99 financial year to the 2011-12 financial year, allowing you to see change over the short term and long term.
What improvements have been made?
The model has been refined and improved in the following ways:
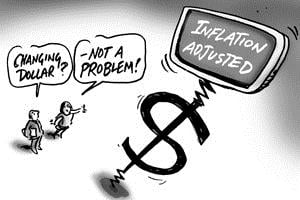
- The price base has been updated – all the modelled datasets are inflation adjusted and now based on average 2010-11 financial year dollars. That means you can directly compare series over time despite the changing value of a dollar.
- All the modelled data now take into account the detailed Journey to Work matrix from the 2011 Census, with change back to 2006 calibrated for the interim years. More detail has been included with all the work activity now modelled at the 2-digit ANZSIC level.
- The model was adjusted to reflect the propensity of those working Full Time to travel further to get to work. The employment, hours worked and value-added now better reflect the reality of full and part-time workers in each area.
- Better representation of the location of mining activity. More of mining activity is now attributed to the area in which the mining occurs, dispersing it from the head office locations, and mining services, into the areas where the work is actually carried out. Some mining activity is still attributed to administrative locations, but it should better represent the distribution of the location the work actually occurs than the previous model did.
- Agricultural income transferred to foreign residents (foreign ownership) is now correctly attributed out of the area, so the local value-add of agricultural industries may have reduced in some cases.
- Local Gross Regional Products now correctly attribute changes in commodity values to the local area in which the activity takes place. An increase or decrease in commodity value will now affect the value added of the industry and the Gross Local Product (industry) of the area, but the Headline Gross Regional Product will not be susceptible to changes in commodity values, as it is based on the total output at factor cost (cost of the inputs).
- Imports and exports are now based on state benchmarks at the 3-digit ANZSIC industry level, allowing for the model to be sensitive to different industry makeups in local areas for these parameters. Both local and international imports and exports are now captured separately and this will be included in our site update which incorporates the 2011 Census release, due by the middle of 2013.
Because of this, you may notice some minor differences on your site between the data presented before the update and that presented after the update. Some of this will be due to the change to 2010-11 base prices, while others may be due to the other factors listed above. Areas with a lot of mining employment are likely to be more affected. Don’t forget that the latest year has been updated as well, to 2011-12.
The next update to economy.id will include a revision of the user interface, and the inclusion of all 2011 Census data for workforce analysis.
You can access economic profiles for 50 local government areas across Australia here.


.png)


