Household size (that is, the average number of people counted in the Census in private dwellings in Australia) has been declining for the last 100 years. In 1911, the average household size for Australia was 4.5. By 2006, it had fallen to 2.53. There are various reasons for that, chief among them – the ageing population, people living in their own homes for longer before going into aged care, couples having less children and having them later in life, and a preference for living alone at all ages. But in 2011, something remarkable happened. Household size increased. Not in all areas and not by much, but it did increase, stablising or reversing some of these trends.

Household size is one of the key Census outputs, which reveals a lot about how we are living – how many people there are per bedroom, how many children are in the average family and so on. The 2011 Census reveals a very interesting trend.
The decline of household size over time has been remarkable. With birth rates declining since the 1960s, people marrying much later (and living alone before marriage), having less children, and living longer into their senior years, there has been an unprecedented drop in the number of people living in each household. Just 30 years ago, in the 1981 Census, there were 2.97 people people per household on average.
This chart shows the decline in household size over 100 years.
Average household size, Australia, 1911 to 2006 – From the ABS Australia Yearbook, 2009-10

By 1981, we had fallen to 2.97 persons per dwelling, in 1991 it was 2.78 persons per dwelling, and continued to fall consistently each Census to 2.53 in 2006.
Here is a link to the article from which the chart above is taken. You can see in the projections chart below it that the ABS expected household size to continue to fall.
But the fall slowed in the 2001-2006 period, and from 2006-2011, a remarkable thing happened – average household size actually increased, just slightly (though you do need to go to 3 decimal places to see the increase at the national level). The only comparable period in the last 100 years was during the 1950s baby boom, when the decline stopped for 10 years.
From 2006 to 2011, the average household size in Australia rose from 2.532 to 2.537 persons per dwelling (this figure may differ slightly from those from other sources because it EXCLUDES overseas visitors staying in private households – but we’ve done this for all Census years so it’s consistent).
OK, so a 0.005 increase is not exactly huge, but the point is that it’s been trending downwards for so long that any increase is significant! And at the state level it gets more interesting.
Here are the average household sizes by state in 2011 and 2006:
You can see that the Northern Territory still has the largest households on average for the nation (because Aboriginal households tend to have a higher birth rate). Tasmania now takes the crown as the smallest household sizes in the nation, now smaller than South Australia’s due to the ageing population there.
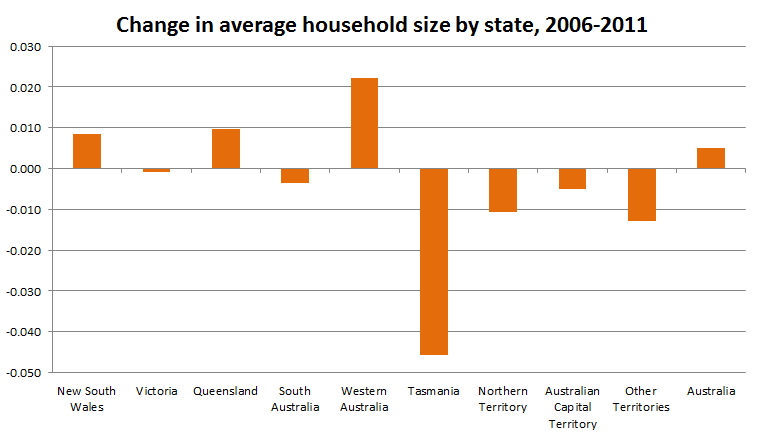
This chart shows the 5-year change on a state-by state basis.

Tasmania has fallen the most, but WA, Queensland and NSW have strongly increased, particularly WA – while Victoria is almost flat.
Partly these figures relate to the building activity happening. Queensland and NSW building industries have been hit by the global financial crisis, and they didn’t build so many dwellings, but NSW in particular still took in lots of overseas migrants over the period. Victoria continued building lots of new houses, particularly in Melbourne’s fringe areas, so that building actually kept pace with population growth.
Tasmania and South Australia’s declines are due to continued ageing of the population with lower population growth in those states.
This chart shows the LGAs in Australia with the largest increases in average household size over 5 years. Very small LGAs with populations under 1,000 people have been excluded.
The areas which are leading the charge towards increased household sizes are just about everywhere in WA, but particularly inner parts of Perth and remote mining areas where they just can’t build enough accommodation for those mine workers. Also in the list are large population areas in western Sydney and parts of Melbourne, where there is a large influx of immigrants.
Areas with the largest decreases are dominated by very small and remote LGAs, including indigenous communities which can have very large fluctuations from year to year. When these are excluded, a pattern emerges.
Generally, LGAs which still have significant declines in household size are regional areas which have not had a mining boom, and which have declining and ageing populations. The only metropolitan LGA to make the top 20 declines is Brighton in Tasmania. The largest decline in household size was in Elliston, SA, down by 0.26 to 2.45 persons per dwelling. A few mining areas in WA make this list too, which proves that people in mining just tend to move around a lot!
There were also many areas which fell by around 0.1 persons per dwelling, including much of regional Victoria and NSW.
So there seem to be two strong trends here, which are almost cancelling out at the national level. Regional areas, some outer suburbs of our main capitals, and most parts of Tasmania and South Australia are continuing the existing trend towards smaller households, due largely to their ageing (and in some cases, declining) populations. On the other side are inner and mid-suburban areas of our major capitals, some mining towns, most parts of Western Australia apart from the wheatbelt, and anywhere with a large amount of overseas migration. These areas have more people fitting into the existing dwellings.
.id’s population forecast team are currently crunching the Census numbers to update all of our existing forecasts. These figures on household size underscore the importance of using local trends and locally based assumptions when doing a forecast, because areas can have completely different trends which can follow or run counter to a national or state trend.
All current forecast clients can expect a desktop update to 2011 populations by the end of November 2012.
Access the new profile.id sites and other population statistics for Australia, States, Capital Cities, Local Government Areas and suburbs at .id’s demographic resource centre.


