To develop successful Economic Development strategies, you need to know about your local economy. You need to know its strengths, and weaknesses. You need to know where it fits in the overall competitive framework – and what role and function your economy serves.

Historically, however, economic profiling of local government areas fell short of the needs of local government largely due to:
- data was difficult to obtain a local government level
- disparate sources of information; and
- a lack of accurate time series data
Economy .id allows close investigation of the structure of your economy, and how it is changing over time. It provides answers to the following questions:
- What size is the local economy?
- How is the local economy performing?
- What is the economic base of the local economy and how is it changing?
- What is the contribution of each industry sector to the local economy?
- How many businesses are in each industry sector and what is their size?
- Where are the jobs in each industry sector located?
- What are the characteristics of the workers in each industry sector?
- Where do the workers in each industry sector reside?
- What are the characteristics of the local residents?
- Where do the residents work?
- What potential skills and knowledge can be drawn from the local and regional labour force?
- What are the infrastructure and asset advantages of the local area?
Answers to these questions can be used to develop policy (or seek grant funding) to support appropriate sectors of the local economy, attract investment and boost local jobs, minimising commuting time and growing the local economic base.
Case study – City of Banyule
Let’s look at an example of how you can use economy .id to uncover issues in your economy that you can use to develop a case for policy development and grant funding.Firstly, let’s look at a simple chart (found under the “how is our economy structured” tab) that will tell us which industries are growing, and which are in decline. We can view this by employment or value added. This lets us see the contribution each industry is making to the economy in terms of actual output, and also its role as an employer.
Let’s look at Value-added first:

We can quickly see that the industries of Manufacturing, Construction, Wholesale and Retail are declining, while others (such as Education and Training, and Health Care and Social Assistance) are growing.
Does this trend extend to employment too?

Yes, although you can easily see that retail has been hit harder (from an employment viewpoint) than the other declining industries.
But we know that many retail jobs are part time, and are often filled by younger people, so a decline in retail may be affecting our youth unemployment.
Let’s look more closely, by looking at the FTE figures – which are often more of an indication of what’s really happening. (sometimes, the effects can be somewhat “hidden” as people are still showing as employed, even though their hours are being reduced)

You can see that by looking at FTE, we see that the decline in retail employment is far more marked than it originally appeared.
Is retail important to your economy? Normally, retail provides a great training ground for first time workers, and a decline in retail can lead to youth unemployment unless there are other opportunities in other industries, locally.
Let’s look at the age profile of retail workers in Banyule to see if that is the case here.

You can see by comparing with Melbourne, retail has tendency to employ younger workers, and that characteristic is even more marked in Banyule – over 43% of all retail workers in Banyule are aged 15-24, which represents over 2000 young people of that age range employed in that industry.
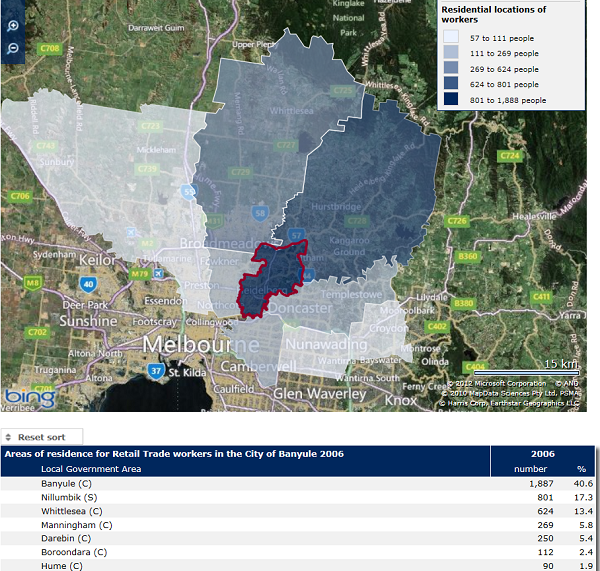
Another useful piece of information is where do these workers come from? Building employment opportunities close to where people live can reduce the need for travel.
The self-containment map shows over 40% of retail workers live in the City of Banyule, and the others come largely from neighbouring suburbs.

By examining the charts in economy .id in this way, you can consider an appropriate policy. You may build a case to offer retraining opportunities to young people, offer transport assistance so they may seek employment in other industries, or perhaps attract other retail outlets based on the vast numbers of trained retail workers in your area. There are many options, but the information in economy .id will enable you to make evidence-based decisions based on what’s really happening.
To see the full list of economy.id clients, please refer to .id’s client list. Also on our website, you will find more information on economy.id. To arrange a presentation at your council, please email info@id.com.au.


