How do populations grow and change?
I’m not normally one of those people who bores their friends with detailed insights from my professional life, but during a recent dinner party conversation I felt the need to open up and provide a more professional opinion. A good friend of mine asked me if it was true that 1,500 people were moving to Melbourne each week. Her use of the word “moving” was interesting – as a demographer it immediately translates to a migration in my mind. Yet migration is not the only way that populations grow and change.

While there’s no doubt that Australia is experiencing strong population growth (read more here) and that a lot of this is driven by high levels of overseas migration, it’s simply not the whole story.
Net Overseas Migration vs Natural Increase
Populations change in two ways – by migration and by natural increase (or decrease), ie by people moving around, and by people being born or dying. These components vary depending on the geographic scale, further adding complexity to the story. At the national level, population change has two main components – net overseas migration (NOM – the difference between those leaving the country and those arriving) and natural increase (the difference between births and deaths). Of these, NOM is quite volatile as it responds to both policy levers and changing economic conditions. For instance, the recent decline in the volume of NOM is thought to be related to the Commonwealth Government tightening the controls on overseas migration (refer to related article).
The chart below shows the volume of NOM and natural increase to population growth in Australia on an annual basis since 1982. Clearly NOM has fluctuated widely, but it should also be remembered that there was a change in the methodology in 2006 (as seen here) which partly explains the sudden increase after that time. There are also correlations with prosperous economic conditions – NOM was relatively high in the late 1980s, peaking at 172,800 in 1988. In contrast, in the early 1980s and early 1990s NOM was much lower, with a figure of just 34,800 recorded in 1993 during that infamous recession that we had to have.
Components of Population Change, Australia, 1982-2010
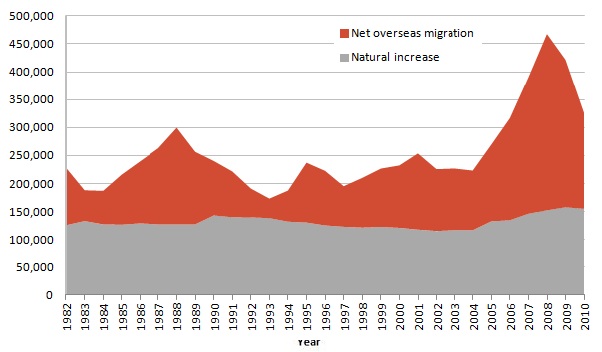
Source: ABS, Australian Demographic Statistics (Cat. No. 3101.0)
Interstate Migration
At smaller levels of geography other types of migration also come into play. Interstate migration is another important component of population growth, and it varies widely across Australia. For example, Victoria has historically recorded net interstate migration loss, particularly to Queensland. The loss of population interstate was particularly high in 1993-94 and is largely attributable to tight economic conditions at the time. However, in the last couple of years Victoria has recorded small gains from interstate migration, which is likely a reflection of the relatively strong employment market, which acts as a pull factor in interstate migration.
What is driving Melbourne’s population growth?
So back to my friend’s question – is it true that 1,500 people are moving to Melbourne each week? Well, no – for a start they’re not all moving here – as mentioned above there are different components of population change. Some people are moving to Melbourne, but some people are born here and some die as well. The 1,500 people per week figure is simply taking the annual population growth of 79,000 persons in the MSD in the period 2009-2010 and dividing it by 52. The ABS doesn’t publish components of population growth below the State level, but some inferences can still be made because natural increase can be calculated.
Between 2004 and 2008, there was an increase in both the number of births and deaths in Melbourne, but the increase in births was higher so this in turn resulted in a higher volume of natural increase. In 2004, there were 46,580 births and 21,540 deaths in Melbourne, resulting in natural increase of 25,040 persons. By 2008, these figures were 53,610births, 23,670 deaths and natural increase of 29,940. If we take 2008, population growth in Melbourne was approximately, 85,500 persons (or 1,640 persons per week). By inference, if 29,940 is attributable to natural increase, then the remainder (some 55,570 persons) must have come from net migration – overseas, interstate and from regional Victoria. If that’s the case, then it’s more like 1,070 persons moved to Melbourne each week during 2008 (net figure), and the remainder of population growth is attributable to natural increase.
Why is this important?
While I don’t expect all my friends to be demographic experts, it does intrigue me that there seems to be a general sense amongst the Australian community that recent increases in population growth relate solely to increased immigration. It’s a view that is apparent in online forums but also appears to be fed through how population growth stories are portrayed in the media. Highlighting migration, or the “movement” of people asthe reason rather than areason for increased population growth ignores the role of births and deaths as a component of change and can lead to misinformed debate about how to manage and plan for population growth. Melbourne has not only been experiencing migration growth, but also an significant growth in the number of babies born each year – and we need to plan differently for each of these components of population change – a story for another blog …
Population growth and change results from the complex interaction of a number of components operating at different geographic scales and across space – it is understanding how and why populations grow and change that equips us to plan for this change.
.id is a team of demographers, population forecasters, spatial planners, urban economists, and data experts who use a unique combination of online tools and consulting to help governments and organisations understand their local areas. Access our free demographic resources here
Simone - Myth Buster
Simone has a rich background in human geography, demography and urban planning – a background that was useful in her previous roles in the Commonwealth and State Governments, and now as part of the forecast team at .id. From the Queensland coast to the southern suburbs of Perth, Simone produces population and dwelling forecasts that help local governments make informed decisions about future service and planning needs. She is a regular contributor to .id’s blog and has spoken at several conferences on how our cities and regions are changing. She is a big advocate of evidence-based planning and how Census and other data can inform this. Outside of work Simone is a keen traveller and photographer – interests that tie in well with her professional life and help her to understand “place”.