Forecasting in New Zealand – Building regional knowledge in the Wellington Region
How do regional population growth, migration and movement affect local populations?
Two new Territorial Authorities in the Wellington Region have recently obtained forecast.id population and household forecasts – Hutt City and Porirua City. Other smaller territorial authorities (TAs) which compose the Wellington Region are Upper Hutt City, Kapiti Coast District, South Wairarapa District, Carterton District and Masterton District. While working on these forecasts, with Wellington City already being a forecast.id client – the importance of regional knowledge in a new area became apparent. We often discuss local and regional drivers of change in our forecast draft workshops, where we sit down with our local government clients and present our assumptions prepared for the forecasts. Understanding each of the ‘main players’ in the Wellington region and their relationship with the other TAs in terms of temporary/permanent population movement (migration), employment and most importantly – housing supply, was paramount in ensuring their forecasts were realistic, comprehensive and aware of regional dynamics.
Prior to commencing Hutt City’s and Porirua City’s forecasts, we already had a relatively sound knowledge of the dynamics and characteristics of these places. We knew what the general capacity and housing markets (role and function) of Hutt City and Porirua City were, but only when they became a forecast.id client, could we invest much more time to learn about these places in detail and how they fit into the regional Wellington picture.
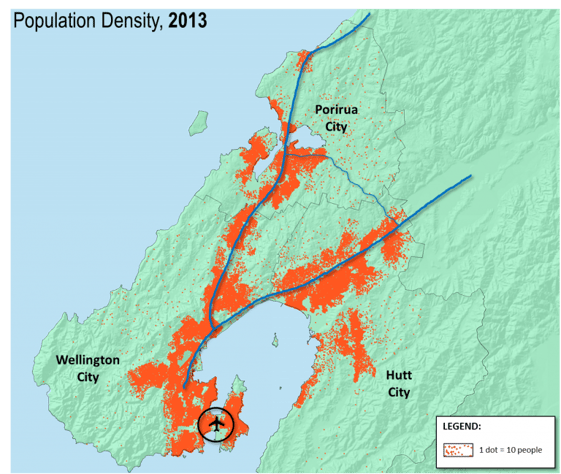
Hutt City, Porirua City and Wellington City are already well connected cities. Often, someone living in the southern suburb of Petone in Hutt City or in parts of Porirua City which are close to Wellington will say that they are “from Wellington” if meeting someone from another part of the country or when overseas. As you can see on the dot density map below, the current population distribution of the three cities shows continuous urban nodes and suburbs along main state highways, from Wellington City in the south, to Hutt City in the northeast and Porirua in the northwest.
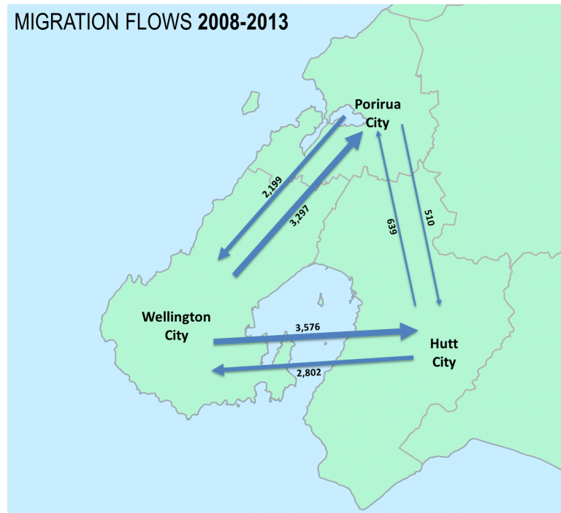
Migration flows between the three cities show a lot of movement in terms of resettlement. These migration flows are quite age specific too, therefore the housing role and function of places is dictated by those who are already living there and those who will move to/move from the area. Those migrating from Porirua City and Hutt City to Wellington City usually represent a younger segment of the population, usually 18-24 year olds who are moving to New Zealand’s capital in search of education and employment opportunities. Those who leave Wellington City and move to Porirua City or Hutt City may also be a segment of the same 18-24 year old age group, but predominantly these are young couples, young and established families aged 25-39 years old who leave Wellington City for more affordable housing options in Porirua or Hutt City. Even within a TA such as Wellington, there are age-specific migration movements. Those who settle in the northern suburbs, with much greenfield residential development supply, are likely to be young and established families and older adults/empty nesters. On the other hand, those who settle in and around the CBD and central areas of the Wellington City will be young adults who live alone or in group households, or as couples without children. The map below shows migration flows between 2008 and 2013. The information originates from the Census question “Where did you live five years ago”.
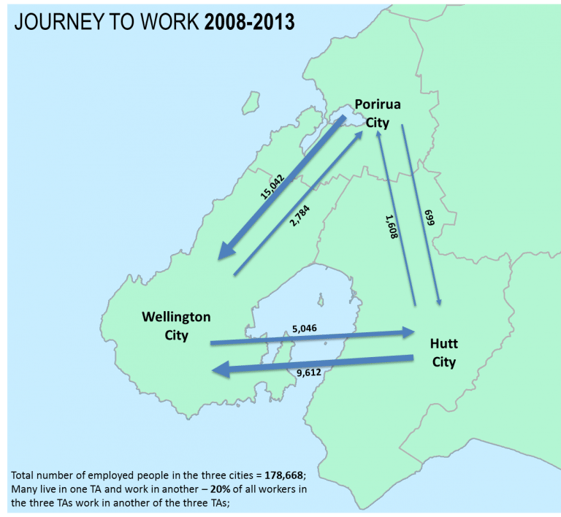
On a more frequent scale – journey to work information, also from the Census, illustrates the connectivity between the TAs on a daily basis. As the map below shows, 15,000 people come from Porirua City to Wellington City every day for work. Just under a third of that number go the other way, from Wellington City to Porirua City, for work. Relatively high numbers of employed residents also cross the “boundary” between Hutt City and Wellington City for work every day. This illustrates that the three TAs are strongly connected. There are 178,668 employed residents in the three cities and 20% of them live in one of the three TAs, but work in another. You should also be mindful that scalability plays an important role here – Wellington City has a population of around 201,000, Hutt City just over 101,000 and Porirua City almost 54,000.
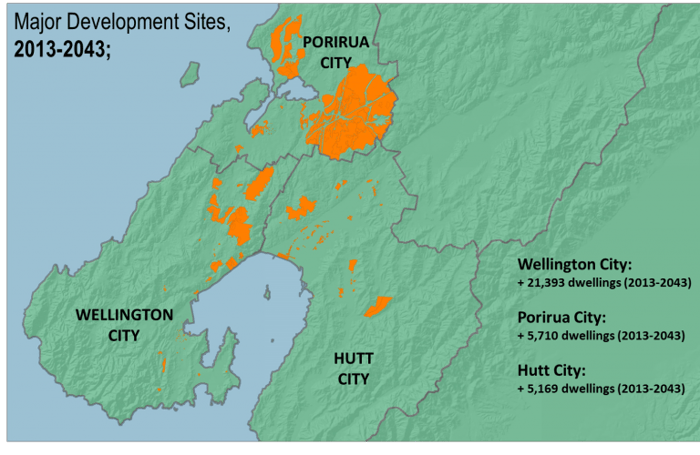
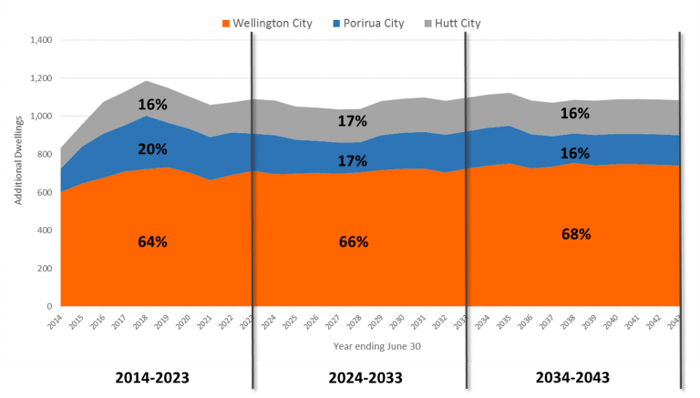
After working on the Hutt City and Porirua City forecasts, we developed a regional picture in terms of residential dwelling supply and capacity. Knowing where residential development will occur and the type of development (in terms of housing stock diversity) allowed us to assess demand across the region and in certain places, reduce or increase rates of assumed development in the future and assess whether a similar “product” (i.e. residential development option) was being offered elsewhere with a competitive advantage. This is the kind of knowledge we apply routinely when assessing forecasts in Australia where we will usually have several if not all local government areas (LGAs) in an area as clients thus allowing us to evaluate regional drivers of change and competing areas. Below are a map and a chart of the resulting pieces of information used in the forecasts which show the extents, capacities and timing of residential development in the Wellington Region. The chart illustrates the share of residential development assumed from 2014-2043 (split into ten year windows) by TA and shows that most of the development (around two thirds – will occur in Wellington City, with Porirua City having an “above-average” share of development in the short term (mainly due to Aotea Block greenfield development), before developing at at similar volumes from 2023 as its neighbour, Hutt City.
After both the Hutt City and Porirua City forecasts were completed, I found having all this information at our disposal has created a symbiotic relationship between the three TAs in terms of regional knowledge. The new knowledge certainly helped the creation of the Hutt City and Porirua City forecasts, but now having these two forecasts and their associated information as part of our regional knowledge, we are also equipped with a better understanding of the region for the upcoming review of Wellington City’s forecasts (next month). This is the first in a series of blogs about our recently completed New Zealand forecasts. They will be brief, informative and (hopefully!) interesting blogs about each of our new forecast.id clients (Hutt City, Porirua City, Whanganui District and Far North District) and will provide some narrative as to what the unique stories are in each of these territorial authorities and what drivers of change make these places tick.
.id is a team of population experts, who use a unique combination of online tools and consulting to help organisations decide where and when to locate their facilities and services, to meet the needs of changing populations. Access our free demographic resources here.
Nenad Petrović
Nenad’s background is in geosciences and geographic information systems. At .id, Nenad has experience as both as a demographer and population forecaster. His areas of expertise are place-based analysis, identifying spatial patterns in demographic trends, community profiling, catchment analysis and an understanding of role and function of different communities.


