Why spatial analysis matters – the example of Western Australia
For much of the past decade, population growth in Western Australia (WA) has been above the national average. This has been particularly the case since 2006, largely driven by the increased labour demands of the mining industry. Over the period 2005-2010, annual population growth in Western Australia averaged 2.6%, compared to 1.8% for Australia. In 2009-2010, the population growth rate in WA was still the highest in the country (2.2%), representing an increase of just under 50,000 people. While much of the focus is on WA’s rapid growth as a state, geographers are well aware that spatial analysis at smaller levels of geography often reveals a different picture.

The spatial aspect to population growth
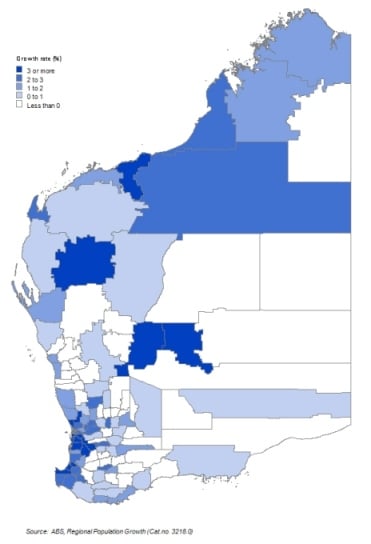
Local Government Areas (LGAs) are one of the most easily recognisable spatial units, and the ABS publishes annual population figures at this level of geography (Regional Population Growth (Cat. no. 3218.0). The map below shows the annual average growth rate by LGA in Western Australia in 2009-2010. Areas with darker shading correspond with areas of rapid population growth. Areas with no shading recorded negative annual average. Clearly, while WA as a whole has grown strongly, this is spatially confined and there are many regions that have declining populations.
Areas with rapid population growth
WA has a large number of LGAs and many of these have very small populations, which, when examining population growth rates, can distort the picture somewhat. However, two main trends can be discerned. Firstly, in Perth, strong growth mirrored patterns in other large Australian cities, such as growth on the urban fringe as well as parts of the inner city. In addition, many parts of the peri-urban ring around Perth (particularly coastal LGAs to the south), grew strongly. Secondly, the location of mining operations across the state corresponded with areas of strong population growth. In fact, the highest rates of population growth in 2009-2010 occurred in three LGAs with populations under 2,000, simply because they contain significant or developing mining operations. These were Leonora (12.5%), Sandstone (7.5%) – both located in the remote mid west – and Boddington (7.0%). Boddington is an interesting example because its recent population spurt has been influenced by mining activity in the region, but it is also located within a two hour drive of Perth’s CBD in an area of rural amenity, which means it is accessible to people seeking a rural lifestyle. The steady population growth since 2001 no doubt reflects this, as well as the growth of tourism and the recent increase in mining activity.
Elsewhere, the LGA of Perth, covering the CBD and surrounding area grew by 5.1% in 2009-2010. Perth’s population has doubled since 2003, and stood at 17,955 in 2010. Rapid growth was also recorded in Capel(5.4% – located on the coast between Bunbury and Busselton), the southern Perth LGA of Armadale (4.9%), and Chittering (4.9% – located north of Perth in the peri-urban belt). The LGA to record the largest absolute growth (just under 6,000 persons) was Wanneroo, on Perth’s northern outskirts. Wanneroo’s population in 2010 was about 150,100 – more than double the figure recorded in the late 1990s and indicative of the very rapid urban growth and expansion in this region.
LGAs in the Kimberley and Pilbara regions with mining operations also recorded rapid growth in 2009-2010, but this is also a result of increasing tourism as well as the momentum for services generated by the existence of the “fly in fly out” workforce that characterises many of the mines in the north of the state. Port Hedland recorded the strongest growth of LGAs in this region during 2009-2010 (4.0%) to reach a population of 14,624. Broome and Roebourne have larger populations but recorded more modest growth of 2.8% and 1.7% respectively.
Where is the population declining?
Of WA’s 139 LGAs, 43 recorded zero or negative population growth in 2009-2010. Many of these are located in the remote interior and the Wheatbelt region. They tend to have small or rural populations that have been in decline for some time. Cue, located in the Mid West region about 600km northeast of Perth, recorded a decline of 7.9% in 2009-2010, and saw its population drop below 300 persons for the first time in several decades. Established in the 1890s Gold Rush, it was a sizeable urban centre in the early twentieth century. However, the depletion of the gold mines and subsequent out-migration of the workforce has led to the gradual demise of the region. Population decline in the WA Wheatbelt is an established phenomenon and reflects trends occurring in other inland agricultural areas such as lower labour requirements on farms, out-migration of youth, and ageing populations.
A little bit of history repeating?
Population growth driven by mining activity is not a new phenomenon in WA. Many localities, such as Cue referred to above, were established in the 1890s Gold Rush and grew quickly as people sought to make their fortunes. More recently, many towns in the north of the state, such as Karratha were established in the 1960s specifically to house the mining workforce. However, as the experience of a gold mining region such as Cue has shown, dependence on one industry makes a region vulnerable to economic change. The Shire of Ravensthorpe provides an interesting contemporary example. Population growth was very strong over the period 2005-2010 (6.3% p.a.), but this actually masks a decline that has been occurring since 2008. Construction of the Ravensthorpe nickel mine from 2004 resulted in rapid population growth, and this was maintained after the mine commenced operations in 2007. Unfortunately, due to financial pressures, the mine ceased operating less than a year after it opened, and the resultant loss of jobs and outmigration (no doubt to mining jobs elsewhere in the state) has seen the population decline from 2,508 in 2008 to 2,349 in 2010.
The challenge for planning
Much of the focus in Australia has been on the challenges presented by rapid population growth, as exemplified by the recent release of the Commonwealth Government’s Sustainable Population Strategy for Australia. There is no doubt that a rapidly increasing population places pressure on resources, infrastructure and service provision, but even in Australia’s most rapidly growing state, there are areas where the population is declining. These places face different pressures associated with population change. In an era of economic rationalisation, often the retention of services becomes a major issue. The loss of key services such as banking and government administration create flow on effects across a small economy which then result in a reinforcing cycle of outmigration, further population loss and further service withdrawal.
Spatial analysis matters
The focus on macro levels of geography such as States masks the very different trends occurring at smaller levels of geography. A strong growth rate for WA as a whole, as demonstrated here, does not translate to a picture of population growth across the entire state. Conversely, the reverse is true – though Tasmania’s population is currently growing, it was losing population in the late 1990s. At the same time however, there was still moderate growth recorded in some parts of Hobart. This is why spatial analysis is such an important tool.
A key strength of Census data is the very fine level of geographic detail for which demographic data is made available for analysis. But between Censuses, a wide range of data is released by the ABS at sub-State level. This article has analysed population change at the LGA level, but it is not always the best geography to use. Canberra, for example, does not have LGAs, so the SLA level is more useful in that city for small area geographic analysis. At .id we tend to use suburb or localities as a useful geographic unit that is recognised by both planners and the community.
As noted on this blog previously, the ABS has implemented a new geographic classification, the Australian Statistical Geography Standard, which will take effect from July 2011. New geographic levels such as the SA2 will permit a finer level of geographic analysis than is currently possible with SLAs. The release of ERPs at this level of geography in June 2012 will no doubt reveal some interesting trends for planners, researchers and spatial analysts alike.
.id is a team of population experts who combine online tools and consulting services to help local governments and organisations decide where and when to locate their facilities and services, to meet the needs of changing populations. Access our free demographic resources and tools here.
Simone - Myth Buster
Simone has a rich background in human geography, demography and urban planning – a background that was useful in her previous roles in the Commonwealth and State Governments, and now as part of the forecast team at .id. From the Queensland coast to the southern suburbs of Perth, Simone produces population and dwelling forecasts that help local governments make informed decisions about future service and planning needs. She is a regular contributor to .id’s blog and has spoken at several conferences on how our cities and regions are changing. She is a big advocate of evidence-based planning and how Census and other data can inform this. Outside of work Simone is a keen traveller and photographer – interests that tie in well with her professional life and help her to understand “place”.