As part of the new statistical geography called the ASGS (see earlier blog – The new geography standard – what is it and how does it affect me?), the ABS is fundamentally changing the boundaries on which Census data is distributed. It is replacing the Census Collection District with a new unit, called, rather uninspiringly, the SA1, or Statistical Area Level 1. How will this affect Census analysis and in particular, time series?


Before you start, you may like to catch up with the previous post on this topic.
Part 1: The new geography standard – what is it and how does it affect me?
You may also like to read other posts on the new ABS geography:
Part 3: Replacing SLAs with SA2s
Part 4: Understanding the new ABS Geography part 4. SA3s and SA4s
Part 5: New ABS Geography part 5: Greater Capital Cities – are they greater?
What are SA1 areas?
For over 40 years, the smallest unit that Census data was available for was the Census Collection District (CCD, or just CD if you’re inside the ABS). These were revised every Census to allow for growth and boundary changes. The CD had to serve two masters – it had to be a convenient collection unit, that was compact, could be walked around in urban areas, had visible boundaries that Census collectors could use. It also had to be a logical unit for the output of Census data.
You can see the Census Collection Districts in action in any of .id’s community atlas information tools. For example the City of Brimbank, Vic, or the City of Auburn, NSW.
With the new geography, ABS is now defining units based on meshblocks, which are very small areas, usually a single urban block of 20-50 households. However, the only data that will be available at meshblock level are population and dwelling counts.
For delivering more detailed data sets, the ABS will be combining meshblocks into a new basic unit, called, rather uninspiringly, SA1 – or Statistical Area Level 1. Each SA1 will contain on average 6-7 meshblocks.
These meshblocks, and hence the SA1s made of them don’t have to align to anything visible on the ground, because they are not designed for Census collection. ABS is defining new areas called Collector Workloads which will only be used for the collection and not seen by the outside world (for some reason, though, the ABS passed up this great opportunity to make those workloads run entirely along visible boundaries, and based them on meshblocks too. This means that there will be some collection areas where collectors are going to have trouble finding their boundaries).
What do SA1 areas look like?
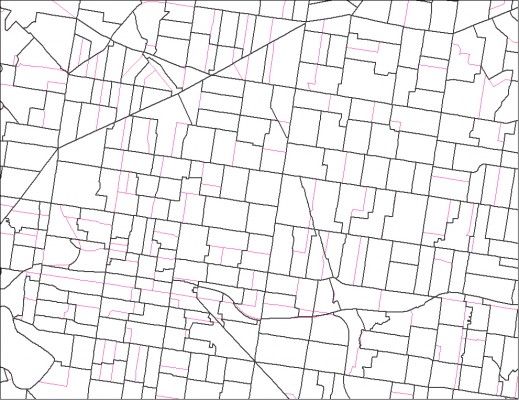
Just to give you an idea of what these SA1s look like compared to CDs, here is an example from metropolitan Melbourne, in an established area which has changed very little over the past 20 years (dark boundaries are the new SA1s, light red the old CDs).

As you can see, the boundaries are quite different, bearing little relationship to the old CDs. So this is one drawback of the new areas as it will be difficult to compare small area data in 2006 with the new 2011 Census data (but don’t worry, .id will take care of this for you.)
What do the changes mean?
One positive is that they now are likely to align a bit better to official suburb and locality boundaries, so that ABS data should match .id’s suburb-based numbers a little more closely. Hopefully they should also align to logical demographic boundaries as well, because this was one of the criteria which was used in design.
One notable disadvantage is that ABS have removed some of the small areas used to delineate very small towns, so that some of the towns we have used in snapshots for profile.id will no longer be available in 2011. Basically if it’s under 200 people, the ABS doesn’t recognise it any more, which is disappointing for those in local government who need information on these communities. For example, the town of Springhurst (population 184 in 2006), in the Rural City of Wangaratta no longer has an SA1 allocated to the town, so data in 2011 will only be available for the broad rural area including the town.
In summary
SA1 is the new smallest level unit replacing the collection district for Census dissemination. It will become the basis of .id’s community atlas maps, and be used to construct suburbs and small areas in our community profiles and population forecasts.
Advantages
- Better alignment to useful boundaries in many cases. Most SA1s align well to gazetted locality/suburb boundaries.
- Better resolution – more SA1s across Australia, no really large populations lumped into one area because of growth.
Disadvantages
- Break in series means that it will be very difficult to compare CD level data from 2006 to SA1 level data from 2011. This is one of the significant benefits that.id offers to our clients. We will take care of concording all the different geographies so that you are able to make comparisons over time.
- Very small towns and sparsely populated rural areas will lose data.
If you enjoyed this article, sign up to get updates via email or twitter (above), and feel free to share it.


