Migration within Australia – the hidden story in profile.id
In the “Additional Data” section of profile.id is the Migration section. This section contains some of the most powerful storytelling within the profile, and can explain a lot of the changes that you see in your area. The migration section tells you why the population is going up or down and where people are moving from and to. While we spend a lot of time looking at migration from overseas, migration from within Australia is just as important, and in many areas much more important.
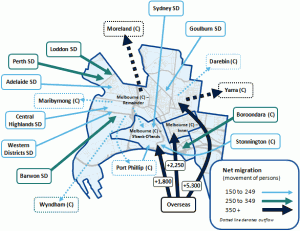
Migration is derived from the Census question which asks each person where they lived 5 years before. Having this answer, and knowing where they live at Census, enables us to tally up the number of people who moved in to an area, subtract the number who used to live there but now live elsewhere and get a “net” figure. The population matrix used to do this is large and complex, but we present it in profile.id in a simple way – by showing the top 10 areas of net movement in, and net movement out.
Example: City of Brimbank (Melbourne, Victoria)
Under “Where did the current residents live 5 years ago?” we can see that 64% of those in Brimbank in 2006 were at the same address as 5 years before. This is quite a high figure and indicates a sedentary population. The average is about 53% across Australia, and high mobility areas such as inner Melbourne and Sydney have more like 25% of residents at the same address over 5 years.
Then look at “Where do people move from and to?“, and you can see that Brimbank loses population both within Victoria, and a small amount interstate. Scrolling down to the list of individual LGAs, you can see that the lion’s share of Brimbank’s migrants moved to nearby Melton. In fact over 5 years, only 1,444 people moved from Melton to Brimbank, but 10,131 people moved from Brimbank to Melton – it’s almost a one-way movement! Why would this be?

The answer is that it’s movement within an urban corridor. We know that most people like to stay within the same region of the city they grew up in. But when they leave home, young adults will move out to the urban fringe in the same corridor. So Brimbank gains population from Maribyrnong, loses to Melton (and Wyndham). On the other side of Melbourne people move from Monash to Casey to Cardinia, or from Darebin to Whittlesea etc. In Brimbank, at 2006, growth slowed right down while it continued apace in Caroline Springs (Melton Shire). Since then, some growth, in areas like Derrimut, have come back to Brimbank, so it’s likely that the very large loss to Melton might have moderated in the next Census.
Common forms of migration
If you look at “What is the age structure of people who moved?” you can see which age groups your area attracts from elsewhere, and which age groups leave your area. Generally, outer suburbs and country areas lose young people aged 15-24 and gain families. Have a look at Wollondilly NSW, Yarra Ranges Vic and Barossa SA. In contrast, inner cities and areas with universities attract large numbers of people in their late teens and 20s and lose them in their 30s. Check out Sydney and Subiaco. Some coastal areas attract large numbers of retirees (usually aged 55-64 – by the time people reach “retirement age” – 65 – migration decisions have mostly already been made). See Great Lakes and Bass Coast.
You can see examples of all the different types of population movement in the migration sections of profile.id
- Within an urban corridor (eg. Casey, Vic – from Greater Dandenong and to Cardinia)
- Towards a university (eg. Randwick, NSW – from all over NSW)
- To the inner city (eg. young people into Sydney, Adelaide and out to the suburbs in their 30s)
- From country areas to major regional towns (eg. From Pyrenees Shire to Ballarat)
- From the city to the regional coast (seachange – eg. Warringah to NSW coastal areas, to Victor Harbor from suburban Adelaide)
One of the most common trends in the 2006 Census was movement to Queensland – Some Sydney LGAs, such as Pittwater and Sutherland had their largest population loss to the Gold Coast. Preliminary figures suggest that this movement has slowed along with the Queensland economy, but we will have to wait for the 2011 Census to get confirmation of this.
.id is a team of demographers, population forecasters, spatial planners, urban economists, and data experts who use a unique combination of online tools and consulting to help governments and organisations understand their local areas. Access our free demographic resources here
Glenn Capuano - Census Expert
Glenn is our resident Census expert. After ten years working at the ABS, Glenn's deep knowledge of the Census has been a crucial input in the development of our community profiles. These tools help everyday people uncover the rich and important stories about our communities that are often hidden deep in the Census data. Glenn is also our most prolific blogger - if you're reading this, you've just finished reading one of his blogs. Take a quick look at the front page of our blog and you'll no doubt find more of Glenn's latest work. As a client manager, Glenn travels the country giving sought-after briefings to councils and communities (these are also great opportunities for Glenn to tend to his rankings in Geolocation games such as Munzee and Geocaching).


