The next article in our migration series looks at Australia’s fastest growing state, Western Australia. This series of articles analyses the data available on the Department of Immigration and Citizenship website, to look at likely changes in the makeup of the population which we will see when the Census results are out next year. Local area information is available, which is very important for planning service delivery.

Western Australia’s population at 2010 stood at 2.3 million, with a growth rate of 2.6% p.a. over the previous 5 years. This is an increase of 280,000 people in 5 years and represents a higher growth rate than any other state. A little under half of this growth is due to international migration, with 120,000 new settler arrivals into WA between 2006 and 2011. Remember that this doesn’t include most New Zealanders who move to Australia and don’t need to apply for residency.
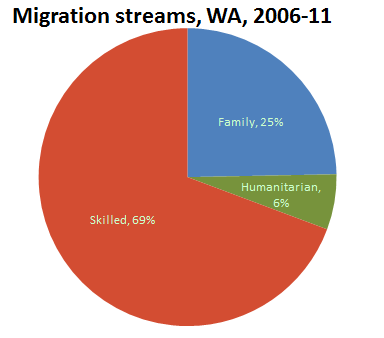
More than any other state, WA settlers came from the skilled migration stream. With mining towns crying out for more workers, both in the mining industry and support services, 69.3% of all WA arrivals came in due to their employment skills. Correspondingly, the state had the lowest proportion of humanitarian arrivals, at just 6.0%, with the family stream making up the remaining 25%.

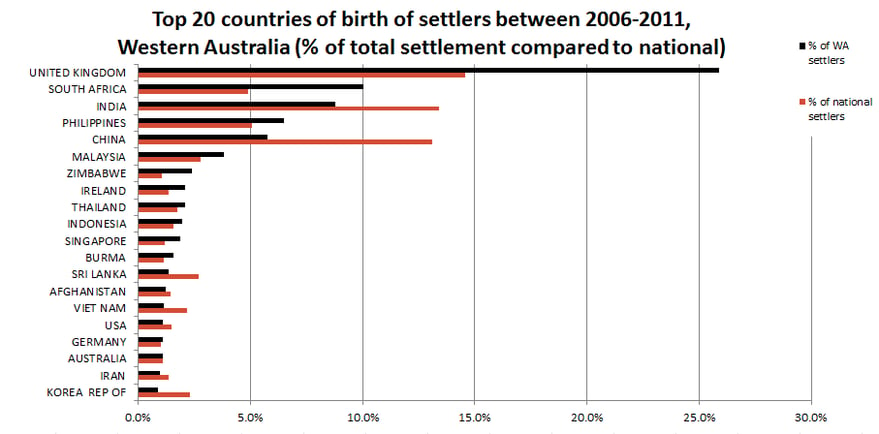
The makeup of the migrant population is also very different to the eastern states. While China and India dominated in NSW and Victoria, WA migration is dominated by the UK and South Africa. The United Kingdom made up 25.9% of all arrivals (31,000 people) into WA between 2006 and 2011, and this accounts for 25% of all UK migration into Australia.
This is not a new trend. At the 2006 Census, 12% of Perth’s population were born in the UK. My father-in-law, himself a “ten pound Pom” used to say that when the ship stopped in Fremantle, English migrants didn’t want to extend their voyage by getting back on board to the east coast, and so got off and made a life for themselves in Perth! I’m not sure how true that is – I suspect the climate has a lot to do with it. Perth’s climate gives them the sun and beach lifestyle many people from the UK dream of.
Migration from South Africa is quite large also. WA receives more South African migrants than NSW and Vic put together, just under 12,000 in 5 years. This should lead to a 50% increase in South African born population at the next Census. The vast majority of these are skilled migrants attracted to jobs associated with the mining sector, and the already large South African community in Perth. And of course it’s a direct flight across the Indian Ocean. WA also has the highest migration of any state from South Africa’s neighbouring Zimbabwe (2,800). Despite significant humanitarian issues in Zimbabwe, the vast majority of migrants come in via the skilled stream.
Of course this is not to say that non English speaking countries are absent. In fact WA’s migration is diversifying. The next largest countries of origin are India (10,500), Philippines (7,800), China (6,900), and Malaysia (4,500).
WA gets only a very small share of humanitarian migrants, but there were 1,900 from Burma, 1,500 from Afghanistan, and 1,200 from Iran over the 5 years.

However, WA does get a very low proportion of Australia’s migrants from China, Vietnam, Korea, Sri Lanka, Iraq and Pakistan.
So where is everyone going? The majority of new migrants settle in Perth. The distribution reflects those areas which already had large populations from the UK and South Africa.
- The City of Wanneroo (13,128) – The fastest growing area in WA also had the most overseas settlers. At the 2006 Census it already had 1 in 6 people born in the UK, so not surprisingly more than half the new migrants were from the UK (6,700 people), and another 14% (1,800) were from South Africa. A mixed group of other countries were also represented, with some humanitarian migration from Burma, Sudan and Afghanistan the main other countries of note (each less than 300 people).
- The City of Canning (12,420) – In the south-eastern suburbs of Perth, this area has grown due to proximity to Curtin University and substantial industrial growth. It is one of the most diverse areas of Perth, and the UK in this area only ranked as the 5th largest country of origin, behind India (1,800), China (1,600), Malaysia (1,400) and the Philippines (700). Canning also had the largest Sri Lankan migration into WA (650), and substantial humanitarian migration from Afghanistan and Burma.
- The City of Stirling (11,929) – Stirling is the largest LGA by population in WA, and have a wide range of migrant groups. India was the largest (1,600), followed by the UK (1,400), South Africa (800), China (600), Philippines (500), Burma (450) and Sudan (400).
- The City of Joondalup (9,050) – Along with neighbouring Wanneroo, and Rockingham on the other side of Perth, Joondalup has the largest concentration of people from the UK in Australia, and like Wanneroo, more than half (4,700) of the migrants to Joondalup from the UK. The next largest countries were South Africa (1,700), Ireland (400) and Zimbabwe (250).
- The City of Rockingham (5,549) – Another English hotspot – migration to Rockingham is almost entirely comprised of the UK (3,660 – 66%) and South Africa (700 – 13%).
Despite the mining demand for workers, remote mining towns had relatively low numbers of direct settlers, with Kalgoorlie/Boulder being the highest, at 1,231 people (South Africa, Philippines, India, Zimbabwe), followed by Roebourne (568 – Philippines, India, South Africa) and East Pilbara (212 – Zimbabwe, Papua New Guinea).
In regional WA, but not directly associated with mining, the City of Albany had the highest migration (717 people), mainly Philippines (365) and South Africa (120).
To view comprehensive community profiles of these areas where available, click here.
Once the 2011 Census data is released we will get information on all these communities at the local suburb level, and our profile.id subscribers will be able to access information on population change back to 1991, and the full list of over 100 countries of birth for their areas. It will also reveal whether most migrants stay where they initially settle or move substantially into new areas.
.id is a team of demographers, population forecasters, spatial planners, urban economists, and data experts who use a unique combination of online tools and consulting to help governments and organisations understand their local areas. Access our free demographic resources here


