In a recent blog we looked at employment self-containment, which is a measure that looks at the proportion of residents who work locally. Self-sufficiency is the opposite side of the coin. It looks at what proportion of local jobs are filled by local residents. If that makes any sense to you, you’re doing better than most! While self-containment is usually an important measure for suburban councils with less jobs than residents, inner urban councils, and more affluent areas are also interested in self-sufficiency.

What is employment self-sufficiency?
In economy.id we define self-sufficiency as the percentage of workers in the local area who also live in the Local Government Area (or region).
Using the City of Wanneroo (WA) example from the previous article, their overall self-containment is 23.2% (proportion of residents who work locally), but their self-sufficiency is 50.4% (proportion of local jobs that are filled by local residents). Most outer suburban areas will have higher levels of self-sufficiency than self-containment, particularly if the jobs are part-time or casual retail jobs, for which people would be less willing to commute long distances.
For the City of Wanneroo, there is likely to be less interest in self-sufficiency than self-containment, for the simple reason that there are more workers than jobs in the area, so it is likely to be easy to fill any new jobs with local workers (unless they are highly specialist, in which case looking at the data by industry or occupation could help).
Areas with a high ratio of jobs to workers, and particularly areas which are expensive to buy or rent housing in, are likely to be more interested in self-sufficiency. A good example would be the WESROC councils in Perth. These include Peppermint Grove, Cottesloe, Claremont and Nedlands, among the most affluent areas in the country.
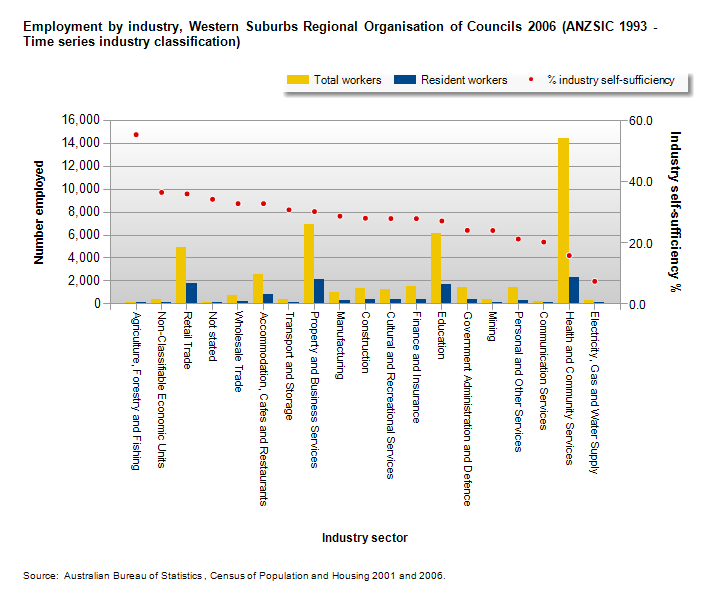
Here is the chart of self-sufficiency by industry for the WESROC area. The overall level of self-sufficiency for the area is 25.2% – the majority of the workers in WESROC come from outside the region. Rates are particularly low for Health Care (15.8%) which is by far the biggest employer in the area.

This is important information for an affluent area like WESROC. The reasons for the large numbers of workers coming from outside may be that those workers can’t afford to live in the area. Many councils have policies which encourage affordable housing for key workers, and this information can inform those policies.
Alternate Definitions
To this end, some councils, particularly in Western Australia, have a different definition of self-sufficiency, which is closer to economy.id’s definition of self-containment. They measure total local jobs as a percentage of employed residents (regardless of where the employees are sourced from). In essence this is more of a theoretical self-containment figure – the number of jobs which exist locally and could in principal be filled by local residents (if they had the skill set and the inclination to do so).
While this definition is not used in economy.id, the data for it can be extracted from the tables (and don’t forget that all table data in economy.id can be exported into Excel). You will need the first column from “Who are our workers->Self-sufficiency by industry“, which gives you the number of jobs in the area, and divide it by the first column of “Self-containment by industry” which gives you the number of local employed residents.
By this definition, areas such as WESROC with more jobs than employed population would have a self-sufficiency ratio of over 100%, in fact, based on the Census data in economy.id, it is 152%.
In contrast, for Wanneroo, this gives a figure of 46.0% for the state definition of self-sufficiency ie. – if all jobs in Wanneroo at 2006 were filled by local residents, this would be the percentage self containment. It’s about twice the number which we use in economy.id, as some people will always work outside and others will come in to work.
economy.id allows you to look at self-containment and self-sufficiency by industry division, and over a 5-year Census period, so you can see if the trend is going up or down in each industry.
How do you define self sufficiency in your LGA, and is this part of your economic development strategy? We’d love to hear from you.
.id is a team of population experts who combine online tools and consulting services to help local governments and organisations decide where and when to locate their facilities and services, to meet the needs of changing populations. Access our free demographic resources and tools here.


