Australia’s migrants – who are they and how are they changing?
The publication Migration, Australia (ABS Cat. No. 3412.0) is an annual release by the ABS. It provides more detailed information about the characteristics of migrants (both overseas and interstate) than is available in other non-Census demographic releases such as Australian Demographic Statistics. A recent article published in The Age in response to the latest release of data created a storm amongst its readers when it was reported that the Asian born population in Australian would soon overtake the European born. We examine the facts in this blog.

Data published in Migration, Australia updates the Census data on birthplace by considering the birthplace composition of arrivals and departures to and from the country, as well as births and deaths, in the time since. The table below shows the top ten birthplaces of Australian residents in 2000 and 2010. In terms of birthplace, about three-quarters of the population in 2010 were born in Australia (73.2%). This proportion is in decline, and is linked to higher levels of overseas migration. The Australian born population hovered around 76% from 1996 to 2004, hitting a high of 77% in 2000. Despite this, the overall number of Australian born residents increased by 11% over the period 2000-2010.
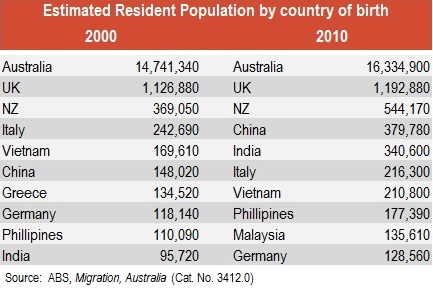
There has however, been some dramatic shifts in the birthplace composition of the Australian population. The United Kingdom (UK) and New Zealand (NZ) continue to be the main overseas born communities in Australia. This is not surprising given our historical and geographic ties to these countries. Anecdotes of Neighbours driven migration from the UK, as well as the momentum from earlier arrivals, appear to have resulted in a population peak in the early 1990s when the UK born in Australia exceeded 1.2 million. Over the last decade, the number of UK born people has been relatively stable, but the increase of 5.3% over the ten years belies a slow but long term decline. Regardless, the UK born are still the dominant overseas born community in Australia, numbering 1.19 million in 2010. In contrast, the number of NZ born in Australia continues to climb, reaching 544,170 in 2010. Given NZ’s population is just 4.37 million, this figure is quite extraordinary. There are more NZ born people in Australia than the total population of Wellington!
Although the UK and NZ born are still the dominant overseas born communities in Australia, the main change over the previous decade has been the growth of Asian born communities. This is a continuation of a trend that has been occurring since the 1980s. In 2010, China was the main non-English speaking birthplace in Australia, with its population approaching 380,000. Between 2000 and 2010, the Chinese born population grew by 10% on average per annum, and the actual number doubled between 2003 and 2010. However even this rapid growth does not compare to the Indian born community which grew by an average of almost 14% between 2000 and 2010. Their numbers trebled between 2002 and 2010, reaching almost 341,000. In terms of growth rates, these communities are growing faster than some of Melbourne’s outer suburbs!
The Age reported that the rapid growth of Asian born people in Australia meant that their population would soon outstrip the European born population. On a broad geographic level, this is highly likely. When all Asian countries are considered, their population was just under 2.1 million in 2010, compared to 2.42 million for all European countries. However, the Asian born population almost doubled between 2000 and 2010, compared to total growth of just 2.9% for the European born.
The shift away from European migration is also revealed in the gradual ageing of persons born in those countries, as shown in the graph below. For example, the Italian and Greek born populations, many of whom arrived as young adults in the 1950s and 1960s, are now approaching old age. In 2010, the median age of the Italian born and Greek born population was 67.5 years and 66.4 years respectively. Migration from these countries is now negligible and their populations are declining as a natural result of their mortality catching up with them. However this is much lower than the median age of the Latvian and Lithuanian born populations (74.9 and 73.6 years respectively). This was the highest of all countries and is not surprising given the main wave of migration from the Baltic States occurred in the immediate post war period. Even the UK born population have a high median age which has steadily increased since 1996 and stood at 53.5 years in 2010. By way of comparison, the median age of the total Australian population was 36.9 years.
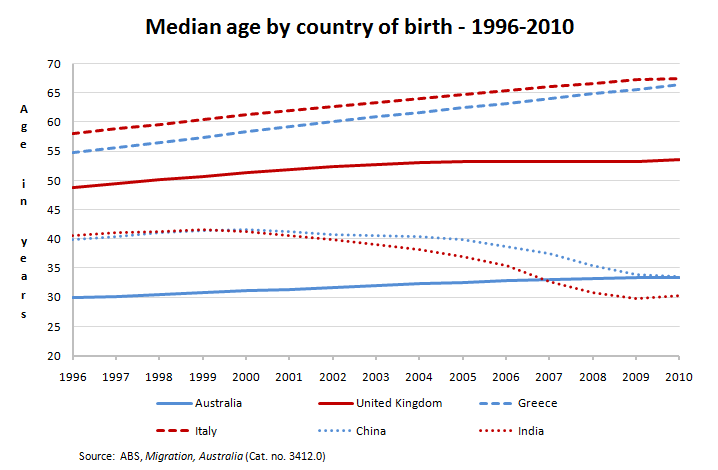
In contrast, the Indian born population has a younger age profile, with the median age standing at 30.3 years in 2010. This was a decline from 40.6 years in 1996 and reflects two main factors – firstly, that there has been significant migration from India to Australia since the 1970s and this first wave of Indian migrants are ageing. Secondly, many of the contemporary migrants are students, who of course are much younger in age and the sheer weight of their numbers has had a dampening effect on the median age. The Chinese born population have a median age of 33.5 years, which has also been declining since the late 1990s, but more rapidly in the last five years as student numbers have increased.
Many commentators would argue that birthplace alone is not a sufficient indicator of the ethnic diversity of a country. Census data is very proficient in this respect, offering other variables such as language and ancestry for analysis. However on the measure of birthplace the statistics speak for themselves – the number of Asian born people in Australia is increasingly at a more rapid rate than the European born. Despite increasing evidence that student visa numbers have declined, there are a number of other factors that influence overseas migration and it is likely that the shift towards Asian migration will continue.
Leave a comment and tell us about how your community is changing.
.id is a team of population experts who combine online tools and consulting services to help local governments and organisations decide where and when to locate their facilities and services, to meet the needs of changing populations. Access our free demographic resources and tools here.
Simone - Myth Buster
Simone has a rich background in human geography, demography and urban planning – a background that was useful in her previous roles in the Commonwealth and State Governments, and now as part of the forecast team at .id. From the Queensland coast to the southern suburbs of Perth, Simone produces population and dwelling forecasts that help local governments make informed decisions about future service and planning needs. She is a regular contributor to .id’s blog and has spoken at several conferences on how our cities and regions are changing. She is a big advocate of evidence-based planning and how Census and other data can inform this. Outside of work Simone is a keen traveller and photographer – interests that tie in well with her professional life and help her to understand “place”.


