The tale of two cities becoming one
When councils merge, it creates a new geographic area with its own unique characteristics. Here at .id, we recently completed a suite of community tools for the amalgamation of the former Canterbury City and Bankstown City councils into the new LGA of Canterbury-Bankstown council. The new council covers a broad area of the western and south-western suburbs of Sydney with an estimated population of 354,948 (2015). While already “merged” in terms of NRL teams (the Canterbury-Bankstown Bulldogs), the merger creates not only the largest LGA in New South Wales but also one of the most culturally diverse, formalising a migration relationship that has existed for some time.
Profiling the community
The new LGA includes 31 suburb-level small areas, and an individual community profile is available for each one. These community profiles tell the story of Canterbury-Bankstown and its defining characteristics, providing council staff and the community with immediate access to relevant community information that is not available for this geographic boundary anywhere else.
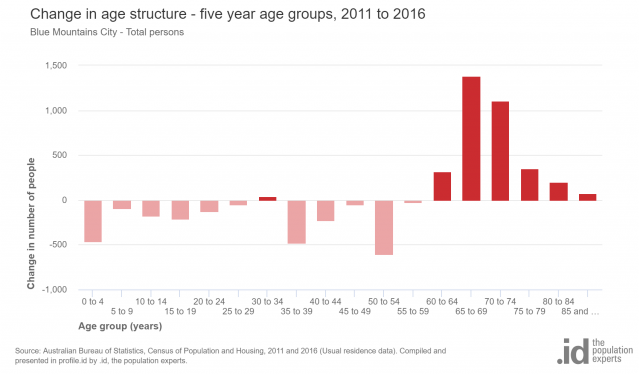
The new LGA has a relatively younger and older population compared to Sydney – both more young children and more elderly population, but less of the peak working-age population between 20 and 50. At the last Census, the area shows large increases in families – namely 0-4-year-olds and 25-29-year-olds – young adults with young children.
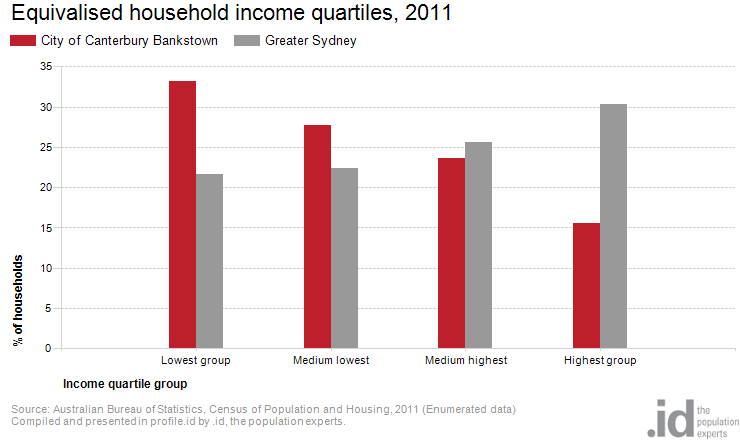
The area remains relatively low income and socioeconomically disadvantaged compared to Greater Sydney, with 33% of households in the lowest quartile for income in the state.
For many years, migrants have moved into Canterbury City (suburbs like Campsie and Lakemba in particular) as an initial entry point to Australia and then moved outwards in the metropolitan area, moving out to Bankstown to upgrade their housing once they become established. Now, with housing costs increasingly pushing people out of Canterbury, they move further out into Bankstown and beyond to begin with. Bankstown remains a place for migrant families to move, particularly in the apartments around the CBD, where there is a very high concentration of young children.
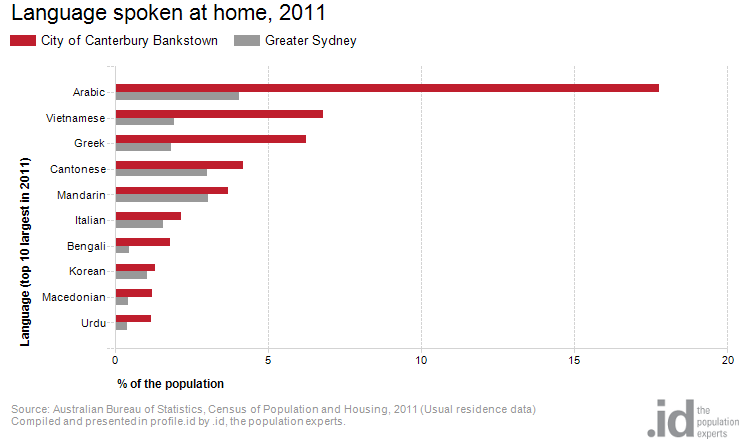
In total, 42% of Canterbury-Bankstown’s population were born overseas, which is high, but there are also lots of 2nd and 3rd generation migrants. When you look at language, 59% of the population speak a language other than English at home, up from 55% in 2006. This varies enormously across the suburbs, from a high of 78% in Lakemba, to a low of 13% in Milperra.
We can see the main languages in the area below, with Arabic being by far the largest after English, spoken by 17% of the population. There is also a very large Bangladeshi population here.
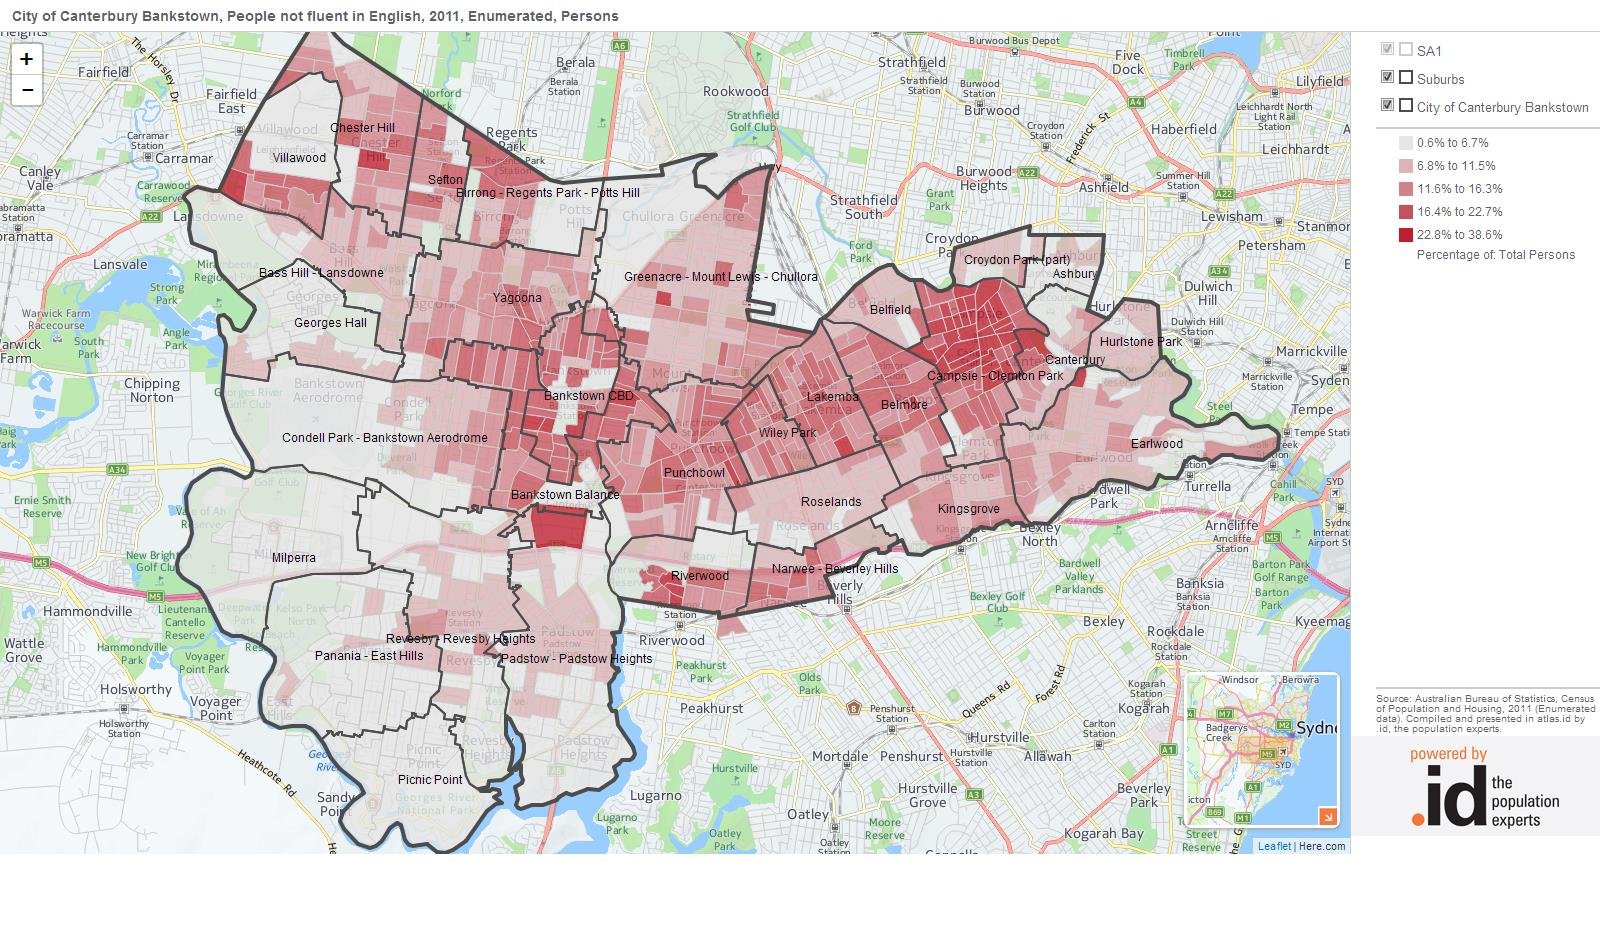
A large segment of the population (12.6% – more than double the Sydney average) report poor English proficiency, which can create challenges when engaging with the community and providing services for people. Local governments and service providers can use .id’s social atlas tool to explore the geographic distribution of people who are not fluent in English. You can see from the map below that the highest concentrations of poor English proficiency are in Campsie, Belmore, Lakemba and Punchbowl, along the railway line, while the south-western parts of the LGA are largely English speaking.
Profiling the local area economy
The new council also represents a growing economic powerhouse. The economic profiles of the area help us understand valuable information about the composition of the economy and where it is heading.
Canterbury-Bankstown is a $13 billion economy, growing at 2.6% in the past year, and making up 2.7% of New South Wales economic productivity.
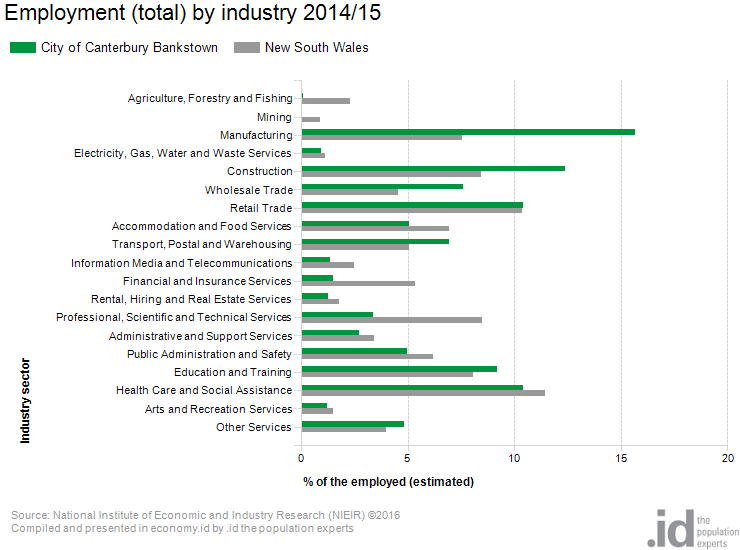
The largest employer by a big margin is Manufacturing, with over 17,000 jobs.
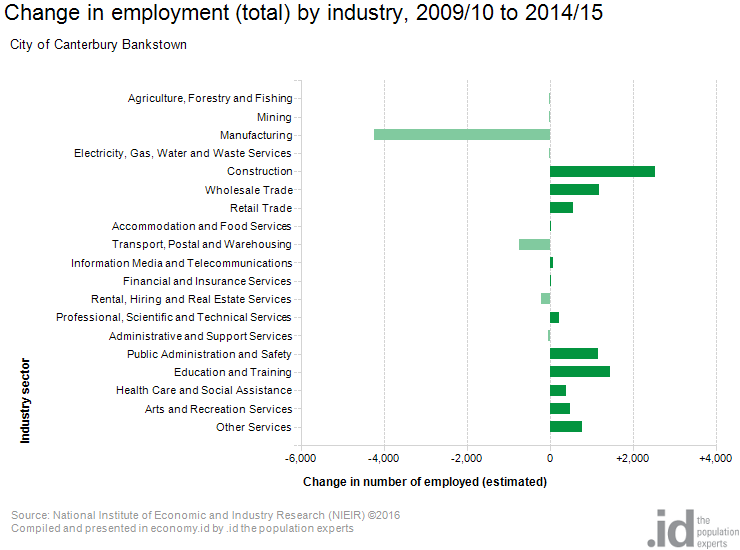
But in line with a national trend, the manufacturing industry is in decline, with a loss of over 4,000 jobs in the past 5 years. The Construction industry and service industries like Education and Public Administration are picking up some of this loss, with the number of jobs still growing overall, but this manufacturing decline presents a significant challenge for economic development in the area, as the local economy transitions from its traditional base.
As the chart shows, more people leave Canterbury-Bankstown to work than come in (despite there being over 110,000 jobs in the area). The main industry where there are more jobs available than employed residents is Manufacturing, which is an area in decline. This information helps show that unless other local sectors are built up, it’s likely that the area’s self-containment will fall as more people leave the area to work.

This type of local area economic information is very valuable to Local Governments, who use it to plan for likely future changes to help future-proof their economy. .id’s economic datasets are updated annually to ensure access to the latest information. Council staff also gain access to the Economic Impact Module for the new area, allowing “What-if?” analysis on the flow-on effects of adding or losing an employer. It is really important for an amalgamated council to have the information for the new boundary as soon as possible.
Understanding the future population
There will also be a detailed, suburb-level population forecast for the new Canterbury-Bankstown area, which will go online soon. These population forecasts allow community planners to understand how the demographics of the population in the area will change in the future.
And of course, the new 2016 Australian Census data will start being incorporated into all our online tools from July 2017 as the ABS starts releasing the data.
If you are interested in exploring .id’s information tools for your council, or are already a subscriber and would like to know how to better use the tools in your area, contact us to learn more.
.id is a team of demographers, population forecasters, spatial planners, urban economists, and data experts who use a unique combination of online tools and consulting to help governments and organisations understand their local areas. Access our free demographic resources here
Glenn - The Census Expert
Glenn is our resident Census expert. After ten years working at the ABS, Glenn's deep knowledge of the Census has been a crucial input in the development of our community profiles. These tools help everyday people uncover the rich and important stories about our communities that are often hidden deep in the Census data. Glenn is also our most prolific blogger - if you're reading this, you've just finished reading one of his blogs. Take a quick look at the front page of our blog and you'll no doubt find more of Glenn's latest work. As a client manager, Glenn travels the country giving sought-after briefings to councils and communities (these are also great opportunities for Glenn to tend to his rankings in Geolocation games such as Munzee and Geocaching).