Who is accessing broadband and who is not? Is it only Regional Australia that is missing out?
With the National Broadband Network (NBN) being hotly debated, we typically hear from the media that regional Australia suffers poor internet access – a fact which we at .id are well aware of given that we are a web-based business and we travel extensively to all parts of Australia. However, is it only regional Australia that is disadvantaged when it comes to broadband access?

In the 2001 and 2006 censuses, the ABS asked questions of each household in Australia about their level of internet connection. .id presents this data in thematic maps at the CCD level in our social atlas product, atlas.id – a resource being utilised by over 120 councils across Australia. I though it may be interesting to explore the spatial distribution of internet access using the atlas.id resource to see if any interesting patterns emerged in well established urban areas.
I have chosen the City of Bankstown atlas.id example as it presents a very strong spatial pattern of broadband internet usage. The spatial pattern of Census Collector Districts with a high proportion of households with a broadband internet connection can be best described as an arc sweeping from the west through to the south of the Bankstown local government area (see the map below).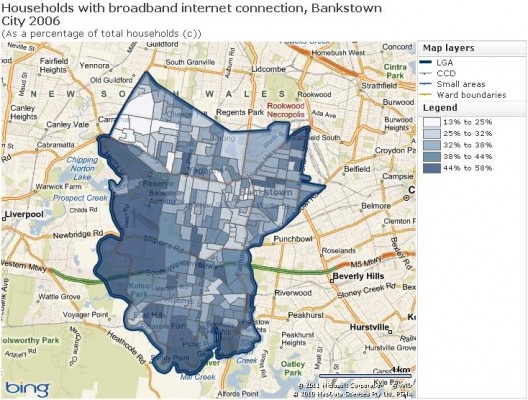
Given such a strong spatial pattern, I suspected that broadband access may be related to socio-economic status, that is, is broadband internet usage from the home strongly correlated to a classic socio-economic status indicator such as income?
Intuitively one would think that it is the wealthier households that would be connected at home to broadband. Sure enough, you do not often get a stronger spatial correlation than that between wealthy households and broadband internet connections. See the map of the spatial distribution of wealthy households below and compare it to extremely similar spatial pattern in the internet connection map above.
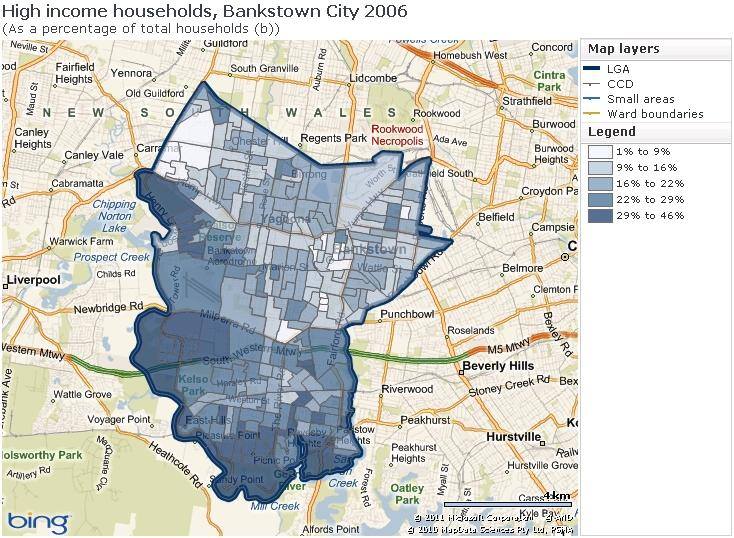
So what does this all mean? I assume that there are similar levels of broadband access across Bankstown, however low income households are not accessing it.
This is important for several reasons. Access to broadband internet is increasingly becoming important in our society not only for business, but our democratic institutions are increasingly conducting their community engagement activities on-line. For example, the ABS will be conducting the 2011 census on-line, with an expectation of up to 40% of households using the on-line facility.
Also, as we point out in the text regarding the internet access question in the Bankstown community profile:
“It is widely accepted that broadband internet access is an essential requirement to participate in the so-called ‘new economy’ and households with only dial-up or no internet service are increasingly being left behind in the information age. Increasingly fast internet access is required for accessing essential information and undertaking domestic and non-domestic business as both government and the private sector are increasingly conducting their business, or aspects of it, on-line”.
It seems it is not only Regional Australia, but the lower socio-economic groups in urban areas that are disadvantaged when it comes to the opportunities offered by broadband technology.To access broadband access statistics for other areas go to .id’s client page and follow the links to atlas.id.
As the National Broadband Network (NBN) debate continues to rage, I am very interested to see what the 2011 Census will reveal regarding this issue – any guesses anyone?
If you enjoyed this article, sign up to get updates via email or twitter (above).
Ivan - The Founder
Ivan is interested in how communities have access to education, housing, health, employment, recreation and each other. People in public and private organisations can be frustrated in their ability to contribute to this “good society” when they don’t have the right information to make critical decisions. Ivan’s idea is to introduce spatial thinking to organisations, look at places through a demographic lens, and use the power of storytelling to be persuasive. Today over 40 smart people have joined him in this mission. Each year over 1.5 million people use id’s 500+ web applications to inform their decision-making. Over 10,000 people subscribe to .id’s newsletter and over 50,000 learn from .id’s blog every month. Today over 30 smart people have joined him in this mission. Each year over 1.5 million people use id’s 500+ web applications to inform their decision-making. 10,000 people subscribe to .id’s newsletter and over 30,000 learn from .id’s blog every month. Ivan loves surfing, his family and the dog.


