Are vacant dwellings in Australia just a coastal phenomenon?
Vacant dwellings seem to get a bad rap in the mainstream press and social media – they are blamed for housing affordability issues, for having negative social outcomes in coastal areas and are even associated with a takeover of AirBnB premises in inner city areas. But is that the whole story? Many people are surprised to learn that around one in ten dwellings are vacant on Census night and this proportion has remained relatively steady over the last few decades. There are many reasons why dwellings are vacant, and the key to understanding part of the vacant dwelling story is the spatial distribution.
In 2016, around 1.04 million dwellings were vacant on Census night, comprising 11% of dwellings across Australia. This is a slight increase in the proportions of vacant dwellings recorded in 2011 (10.2%) and 2006 (9.8%). However, there were distinctive spatial patterns to this with higher occupancy rates found in coastal and inland areas, particularly those with high amenity.
Where are the vacant dwellings?
The map below shows the dwelling vacancy rate by Local Government Area (LGA) for the south eastern part of Australia, where most of the higher vacancy rates are found.
Proportion of unoccupied private dwellings, by LGA, south eastern Australia – 2016
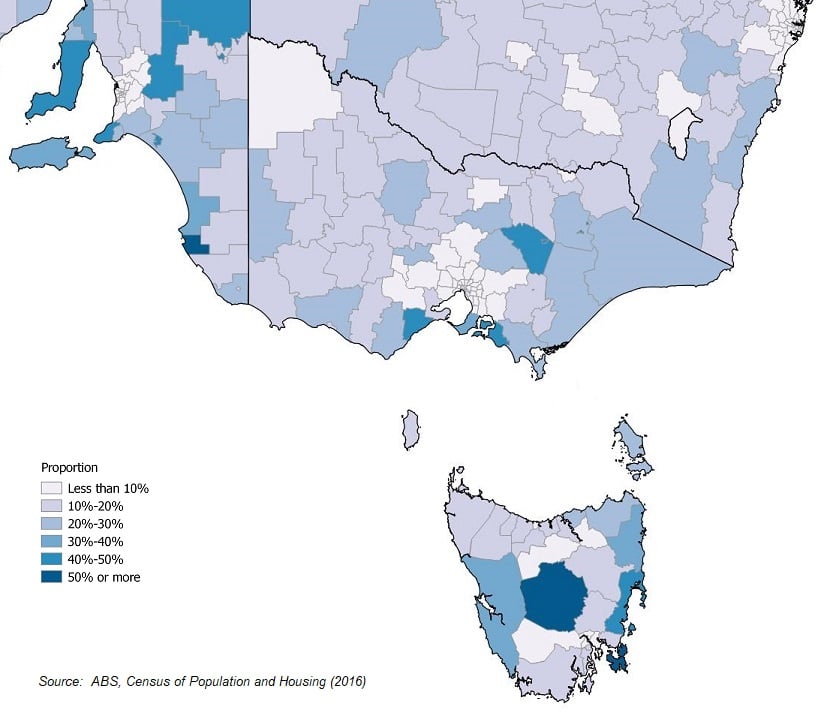
The spatial pattern is generally unchanged since the 2011 Census. The LGAs with the highest vacancy rates are generally located in coastal areas within a two-three drive of a state capital city, particularly around Melbourne, Hobart, Adelaide and Perth. This is not surprising given that the Census is undertaken in August, and holiday homes and weekenders are less likely to be occupied on a Tuesday night in August. On the other hand, there were no LGAs in NSW, Queensland and the Northern Territory with vacancy rates over 30%. The effect of seasonal fluctuations on temperature is less dramatic in northern Australia, so it’s less likely to influence holiday home occupation compared to the southern states. In fact, the LGAs in Queensland with higher vacancy rates tended to be those with a resource based economy, so fluctuations in employment and economic conditions are more likely to influence dwelling vacancy rates.
Southern NSW does have higher vacancy rates, the highest recorded for Eurobodalla Shire (29.6%). Higher vacancy rates are a well-established trend here as it’s a traditional holiday, weekender and retirement location for Canberrans in particular – it’s only around two hours drive to Batemans Bay. Shoalhaven, located immediately to the north, also had a high vacancy rate (24.7%), but other NSW LGAs with high vacancy rates (aside from Upper Lachlan Shire north of Canberra – another popular location for weekenders) were located in far western NSW. The higher vacancy rates here may be associated with out-migration and population decline.
LGAs with high proportions of unoccupied dwellings
The table below shows LGAs in Australia with the highest proportion of unoccupied dwellings at 2016, and the number of unoccupied dwellings in each of these. There were five LGAs in Australia where more than half of dwellings were unoccupied on Census night, and 16 were more than 40% of dwellings were unoccupied.
| LGAs with high dwelling vacancy rates (more than 40%) – 2016 | |||
| LGA Name | State | Proportion | Number of unoccupied dwellings |
| Central Highlands | TAS | 61.0% | 1,561 |
| Robe | SA | 58.0% | 876 |
| Queenscliffe | VIC | 53.6% | 1,500 |
| Tasman | TAS | 52.0% | 1,168 |
| Dandaragan | WA | 50.7% | 1,486 |
| Glamorgan/Spring Bay | TAS | 49.8% | 1,996 |
| Yorke Peninsula | SA | 48.3% | 4,692 |
| Coorow | WA | 46.6% | 428 |
| Bass Coast | VIC | 44.3% | 11,423 |
| Gingin | WA | 44.3% | 1,721 |
| Mid Murray | SA | 43.0% | 2,904 |
| Jerramungup | WA | 42.1% | 345 |
| Yankalilla | SA | 40.7% | 1,575 |
| Ravensthorpe | WA | 40.5% | 493 |
| Surf Coast | VIC | 40.3% | 7,332 |
| Mansfield | VIC | 40.2% | 2,381 |
Source: ABS, Census of Population and Housing (2016)
The LGA with the highest vacancy rate in Australia is Central Highlands in Tasmania (61%). This LGA covers a sparsely settled part of Tasmania, with no large towns. However there is a high level of natural amenity by way of the national parks, and hence there are holiday homes and fishing shacks which contribute to the high level of unoccupied dwellings – more than 1,500 in total. Tasman Council – which covers the peninsula of the same name – also had a very high vacancy rate (52%). With a high level of natural amenity, historic attractions, and located within two hours drive from Hobart, it’s little wonder that this region is a popular location for holiday/weekenders and second homes.
It’s a similar story for most LGAs with high vacancy rates – they tend to be traditional holiday/weekenders locations on the coast and/or they have high levels of natural amenity. Many of these LGAs are also popular locations for retirees, some of whom move into their former holiday homes. High dwelling vacancy rates are well-established trends, rather than a 21st-century phenomenon. However, there are some inland areas with natural amenity such as Central Highlands in Tasmania, but also Mansfield in central Victoria. Some are also more distant from state capitals, such as Jerramungup in southern Western Australia (west of Esperance).
Inner city vacancy rates
Overall, vacancy rates in metropolitan areas were below the Australian average i.e. less than 10%. However, there was a spatial pattern to these, with LGAs in inner city areas generally having higher vacancy rates. However, these were not on the same scale as the coastal and inland amenity areas described above. Inner and established parts of Perth tended to have higher vacancy rates, with the City of Perth itself having the highest vacancy rate of all LGAs in Australian metropolitan areas (18.3%). Almost one in five dwellings were vacant on Census night, far higher than LGAs covering the CBDs of other major Australian cities. The City of Perth has historically had a higher vacancy rate but it did increase slightly between 2011 and 2016. This may be related to the high rate of apartment construction in the City over this time period, which also coincided with a downturn in population growth associated with lower demand for employment in the mining sector.
The pattern is broadly repeated in other metropolitan areas, though it’s difficult to tell in Brisbane and Canberra as the LGAs are not appropriate for small area analysis in these cities. Using Statistical Area level 2 (SA2s) geography is better for spatial analysis in these cities, and the data on vacant dwellings at that geographic level confirms that inner city locations do have slightly higher vacancy rates. For example, the Brisbane SA2 which covers the CBD had a vacancy rate of 13.8% – about one in seven dwellings. In Canberra, the SA2 of Barton, located adjacent to Parliament House, had a vacancy rate of 20%. Parliament was not sitting on Census night in 2016, therefore any politicians and their staff who have a second home in Canberra would not be enumerated there.
Vacant dwellings, particularly their spatial pattern, forms a critical part of understanding “place” and additionally informs population forecasting work. Stay tuned for further blogs which concentrate on local areas and change over time.

.id is a team of population experts who combine online tools and consulting services to help local governments and organisations decide where and when to locate their facilities and services, to meet the needs of changing populations.
Access our free community profile tools here
Simone - Myth Buster
Simone has a rich background in human geography, demography and urban planning – a background that was useful in her previous roles in the Commonwealth and State Governments, and now as part of the forecast team at .id. From the Queensland coast to the southern suburbs of Perth, Simone produces population and dwelling forecasts that help local governments make informed decisions about future service and planning needs. She is a regular contributor to .id’s blog and has spoken at several conferences on how our cities and regions are changing. She is a big advocate of evidence-based planning and how Census and other data can inform this. Outside of work Simone is a keen traveller and photographer – interests that tie in well with her professional life and help her to understand “place”.