Latest figures show population further concentrated in Australia’s capital cities
The ABS Regional Population Growth (3218.0) publication shows the distribution of population growth across Australia, place by place. One interesting trend which it shows as accelerating is the skewing of population growth more and more over time into the capital cities and larger centres. We are urbanising and centralising our population at a significant rate.
At June 2015, approximately 2/3rds of the nation’s population (of 23,775,000) lived in the Greater Capital City areas (66.7%) and 1/3rd in regional areas.
This varies quite a bit by state.
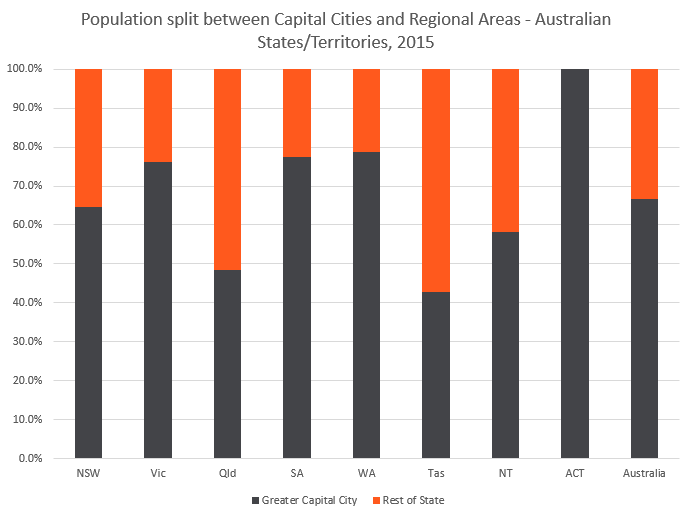
The most centralised states are Western Australia (78.7%) and South Australia (77.5%), while the least centralised are Tasmania (42.8%) and Queensland (48.3%). Note that the ACT is considered 100% urban, with the whole territory being classed as Greater Canberra – hence it is 100%.
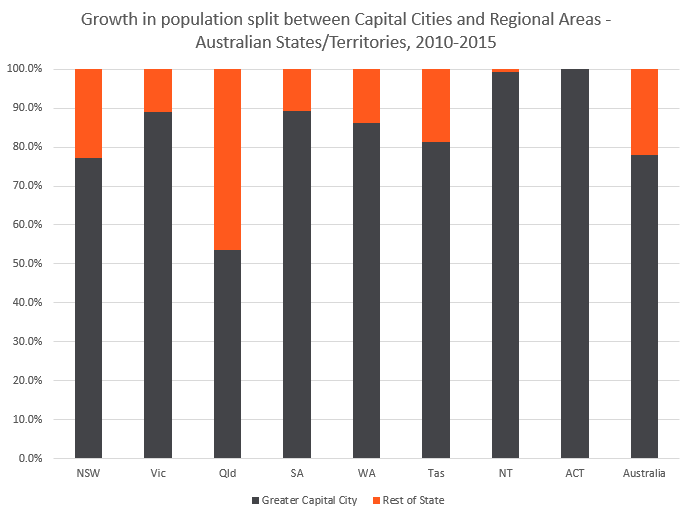
Looking at the growth over the past 5 years, though, from 2010 to 2014, there has been far more in our capital cities than in regional areas.
Nationally, over 5 years, 77.9% of population growth occurred in Greater Capital City areas, and only 22.1% in regional areas. Here is the state split.
But if you look at just the last year’s growth, which was released for the 2014-15 financial year at the end of March 2016, we find this is even more pronounced. Only 17% of national growth in 2014-15 occurred in regional areas, with 83% in capital cities. Regional Northern Territory had a decline in population, so can’t be represented on the chart as more than 100% of the territory’s growth was in Darwin. Apart from that, 92.2% of Victoria’s growth was in Melbourne, and a record 79.9% of NSW growth was in Sydney. A massive 66.5% of all national growth was in Sydney and Melbourne.
Is this due to the concentration of jobs in the capitals, and/or focus of overseas migration to the cities? Or is it an artefact of being 4 years out from a Census and not having a reliable base population to work on? It certainly could go some way to explaining the massive house price increases that the metropolitan areas have seen which have been much smaller in regional areas. These figures will be rebased, however, once the Census data comes out in 2017, so it’s worth keeping that in mind before drawing too many conclusions.
.id is a team of population experts, who use a unique combination of online tools and consulting to help organisations decide where and when to locate their facilities and services, to meet the needs of changing populations. Access our free demographic resources here.
Which age groups are growing fastest in Australia, read our ebook: Three growth markets in Australia
Glenn Capuano - Census Expert
Glenn is our resident Census expert. After ten years working at the ABS, Glenn's deep knowledge of the Census has been a crucial input in the development of our community profiles. These tools help everyday people uncover the rich and important stories about our communities that are often hidden deep in the Census data. Glenn is also our most prolific blogger - if you're reading this, you've just finished reading one of his blogs. Take a quick look at the front page of our blog and you'll no doubt find more of Glenn's latest work. As a client manager, Glenn travels the country giving sought-after briefings to councils and communities (these are also great opportunities for Glenn to tend to his rankings in Geolocation games such as Munzee and Geocaching).


