Using the three P's of economic growth
Every year the Productivity Commission (PC) releases its Productivity Update which aims to explore the different factors driving the growth of Australia’s economy. They do this by breaking GDP growth into three different components commonly referred to as the ‘three Ps’. These same three Ps are used to explore Australia’s future potential in the Commonwealth’s Intergenerational Reports.
So what exactly are the three Ps?
How can you use economy.id to explore the drivers of growth in your economy?
The three P’s commonly refer to Population, Participation and Productivity. They essentially look at how fast your potential workforce is growing (population 15+); how many of them are actually working (average hours worked) and how much value they are generating from their work (labour productivity). Breaking growth down into individual components is a useful way to explore what is driving or hindering the economy. This can change over time, as the PC analysis shows (refer to chart below):
- Population – A consistent driver of growth that was somewhat lower in the 1990s due to low migration intake.
- Productivity – A huge driver of growth in the 1990s as a result of the wave of microeconomic reforms implemented in the late 1980s and 1990s.
- Participation – Large growth in the 1980s due to a rise in females entering the workforce. The recent decline is due to increased unemployment and lower working hours post GFC.
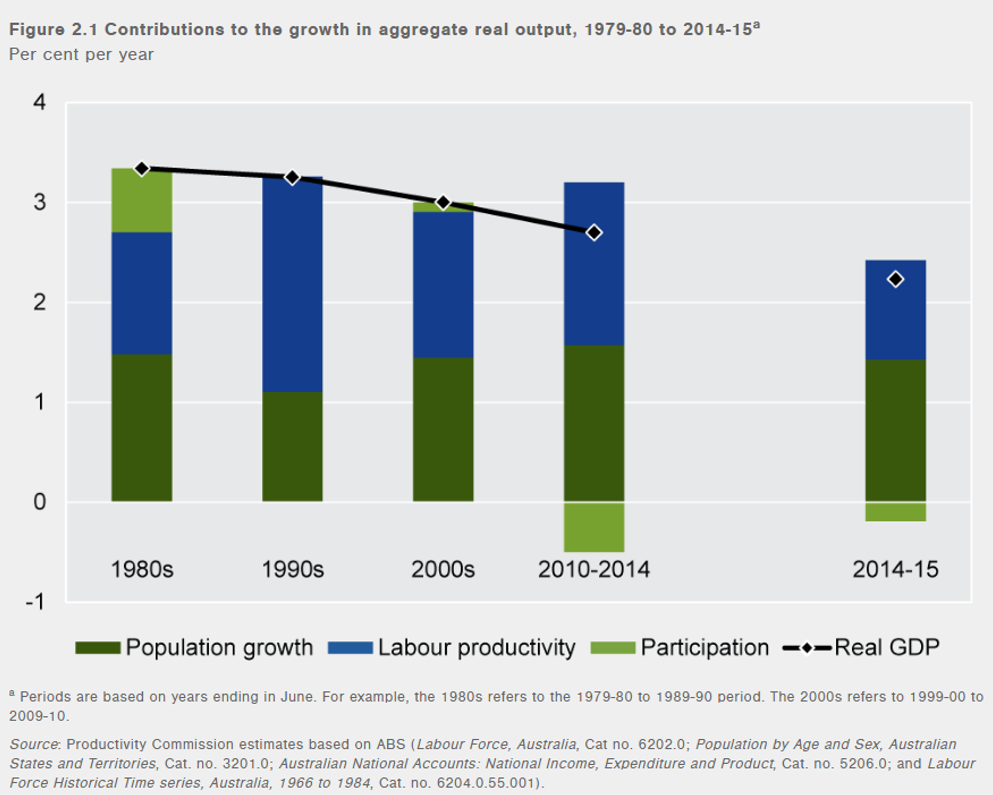
Contribution to Australia’s real GDP growth 1979/80 to 2014/15
While all the P’s will contribute to economic growth, not all will help support rising living standards. A rise in population will naturally contribute to the economy via increased consumption, but if this extra population cannot find work or isn’t supported by necessary infrastructure or education to be productive, economic welfare may actually fall. An increase in labour productivity is generally considered to be the best way to increase GRP per capita and increased participation will help spread the welfare gain
Using the three Ps for your economy: Limestone Coast Region example
It can be relatively easy to conduct a basic analysis of the three Ps for a local economy by using information readily available on economy.id. This can be illustrated through the following example of the Limestone Coast region in South Australia.
Using economy.id for the Limestone Coast, we can conduct a simple three P’s analysis. For a more comprehensive three P’s analysis we would normally use estimates of the population of working age (15+) rather than total population and worker hours instead of number of workers. It is important to note that a three P’s analysis works best when employment in a region is relatively self-contained, which means a high proportion of residents are employed within the local region (88.2% in the case of the Limestone Coast).
Within the economic indicators section of economy.id for the Limestone Coast, we can get the following information for the period 2005 – 2015:
Key Economic Indicators – Limestone Coast Region
Source: National Institute of Economic and Industry Research (NIEIR) ©2016.
These figures can be used to generate average annual growth rates for Population, Participation and Productivity for two separate periods.
Three P’s, 2005 – 2015 – Limestone Coast
Source: National Institute of Economic and Industry Research (NIEIR) ©2016
If we plot these figures and include the growth in GRP, we can identify the main contribution to the different growth outcomes in the two time periods.
Contributions to Growth in GRP, Limestone Coast 2005 – 2015
Source: National Institute of Economic and Industry Research (NIEIR) ©2016
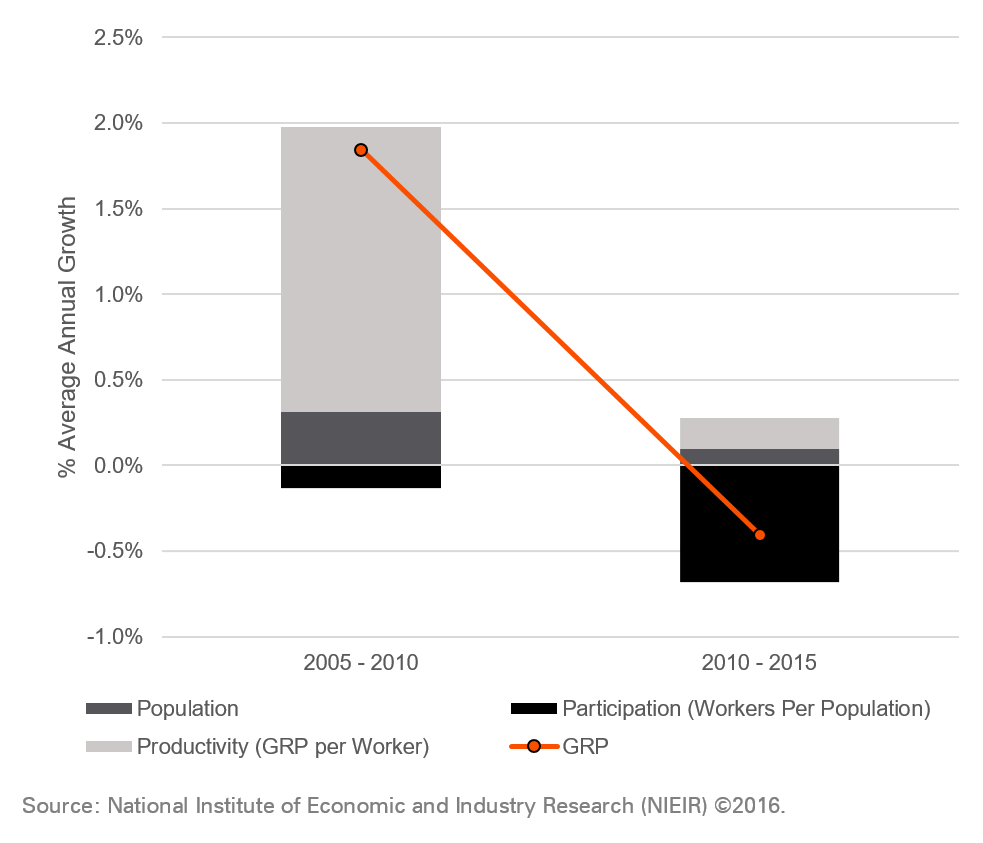
The chart shows the strong economic growth achieved in the region during 2005 – 2010 was largely due to improvements in labour productivity. Whereas the recent negative growth experienced has been mainly due to a fall in participation. (Further analysis could determine how much of this is due to falling labour market participation, rising unemployment, or declining hours worked).
Using the three Ps to inform economic strategy
In the last five years, the Limestone Coast region has seen a substantial decline in participation. However, this is not unique to the Limestone Coast, as we showed earlier that National participation rates have also fallen and in South Australia the average annual change was -0.6% p.a. for the period 2010 – 2015.
Unfortunately for the Limestone Coast, productivity and population growth did not grow by enough to compensate. If the region had experienced similar growth rates in these areas as experienced in 2005 – 2010, it would have seen GRP grow by 1.3% p.a. This generates a number of questions for the region –
- Are there any lessons to be learned from the high productivity growth rates seen in 2005 – 2010?
- Is there necessary infrastructure to support productivity growth in its most valuable sector – Agriculture, Forestry and Fishing?
- Is it investing enough in supporting the development of its workforce and the innovative capacity of its businesses so they can transition into higher value industries?
- How to address an ageing workforce that is contributing to lower participation rates?
The three P’s analysis can be used to direct the focus of economic development strategies. Many regions across Australia such as the Limestone Coast region often focus efforts on attracting population as a mechanism to grow their economy. However, if similar effort isn’t given to supporting participation and increasing local productivity, the region’s welfare may not actually improve.
What does the three P’s analysis of your local area look like? Access your area’s economy.id and share your economic story below.
.id is a team of demographers, urban economists, spatial planners and data experts who use a unique combination of online tools and consulting to help governments and organisations understand their local economies. Access our free demographic resources here.
Keenan - Economic Development Specialist
Keenan is an economic development specialist who has worked extensively analysing and developing economic programs, strategies and policies to help local communities. Keenan works with our local government clients to help them explore and understand how their regions are changing over time to help them make better decisions and create evidence-based strategies related to local economic development.