How much do households in your area spend?
How much does your household spend each year? According to recent data, Australian households spend an average of $95,215 annually, with an average disposable income of $126,546.
Using a new feature of economy.id that estimates household income, you can see how much money is spent on various aspects of life. This is useful for advocacy and provides a new level of understanding for different areas.
As an example, the household expenditure chart below for Sutherland Shire in NSW illustrates the amount spent on different categories of expenditure for the average household in Sutherland Shire.
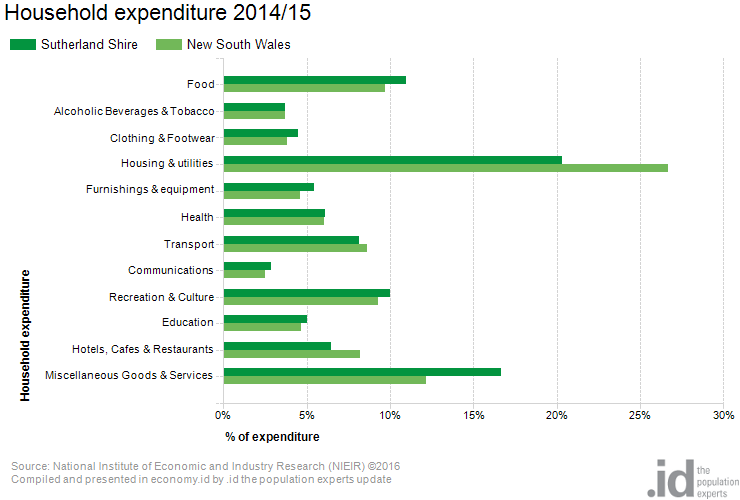
People in Sutherland spend an average of $19,086 per annum on housing and utility costs. But it’s not the actual dollar amount which matters so much as the comparison to the benchmark and change over time. Housing and utility costs represent 20.3% of average household expenditure in Sutherland. This is 11.8% of the average household disposable income in the Shire, which is $162,196, more than $20,000 higher than the NSW average. Across NSW, households spend 19.8% of their disposable household income on housing and utilities – the highest in Australia. This is under 30%, which is usually regarded as the mark of being in housing stress, but it’s important to note that this measure of housing costs includes utilities such as electricity, gas and water bills.
Why would the Shire’s residents spend less on housing? Housing is pretty expensive there after all. Some insight can be gained by looking at their tenure information on profile.id. While mortgage costs are a little higher than the NSW average, there is a large share (37%) of full homeowners, who have no mortgage or rent costs. Rents are also clustered in the middle range rather than the upper end.
In contrast, Sutherland residents spend more than average on Recreation, Clothing and Furnishings.
Compare this to somewhere like Campbelltown, on Sydney’s outer south-west.
Campbelltown households spend close to the average on Housing (their houses are lower cost than the average, but there are more first home buyers with large mortgages, and incomes are lower, so it’s a higher percentage of the total income).
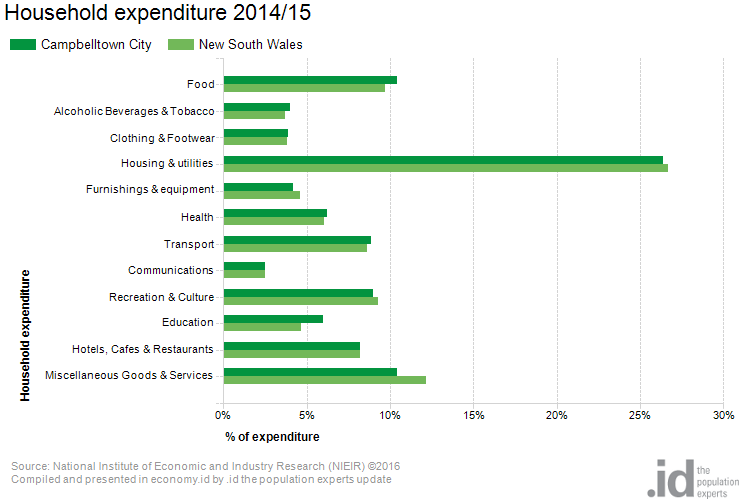
Campbelltown residents also spend a little more on transport than the Sydney average, and more on education, with more residents in the key secondary and tertiary education age groups.
This dataset comes from the NIEIR modelling, which also estimates jobs, employed residents, economic output and value-added, as well as providing the Input-Output tables which underpin the Economic Impact Module. The original source of Household Expenditure Data is the ABS Household Expenditure Survey, which is run every 5 years. This provides the basis for estimating how much each household spends on various commodities. The modelling adjusts this based on the demographic characteristics and geographic location of each place.
You can access the new household expenditure information in economy.id from the left-hand menu under the option “Local Market”. .id is continually improving this tool to enhance the user experience and provide datasets that are relevant and useful in local government advocacy and decision making. If you have any feedback, let us know below!
.id is a team of demographers, urban economists, spatial planners, and data experts who use a unique combination of online tools and consulting to help governments and organisations understand their local economies. Access our free demographic resources here.
Glenn - The Census Expert
Glenn is our resident Census expert. After ten years working at the ABS, Glenn's deep knowledge of the Census has been a crucial input in the development of our community profiles. These tools help everyday people uncover the rich and important stories about our communities that are often hidden deep in the Census data. Glenn is also our most prolific blogger - if you're reading this, you've just finished reading one of his blogs. Take a quick look at the front page of our blog and you'll no doubt find more of Glenn's latest work. As a client manager, Glenn travels the country giving sought-after briefings to councils and communities (these are also great opportunities for Glenn to tend to his rankings in Geolocation games such as Munzee and Geocaching).