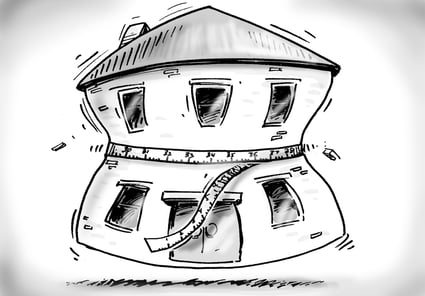
While the size of houses being built in Australia has, on average, been getting bigger, the average number of people living in them has traditionally been declining, and in more recent years has stabilised at an average of about 2.6 people per household.

There are a number of factors contributing to household size. In general, households get bigger as young couples and families have more children and they get smaller as older children become independent and move out of the family home. Of course there are many other factors that contribute to household size, such as fertility rates, extended family-living together and the propensity of non related people to live in group households.
All these factors contribute to the role and function of suburb, town or area and in turn can have an impact on the average household size of that area.
Using the publicly available online information tools profile.id and forecast.id, you can find out how these factors are affecting the household size in your local area or other areas of interest.
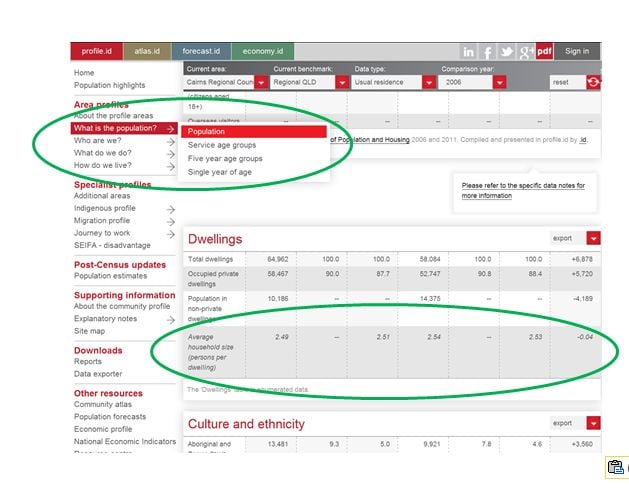
To find average household size from 1991 to 2011 in profile.id got to ‘What is the population?’ -> ‘Population’ -> ‘Dwellings’ section.

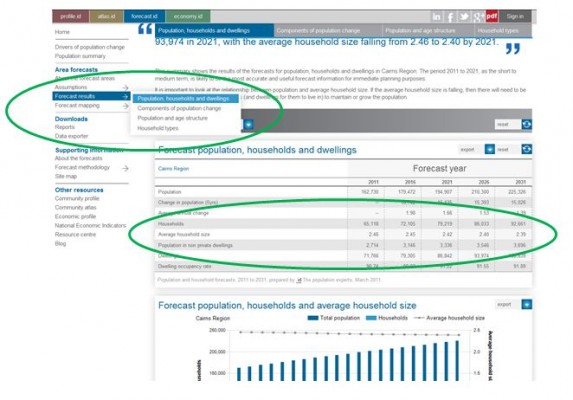
For Local Government Areas that have a subscribe to forecast.id, you can determine how the average household size is likely to change into the future under ‘Forecast results’-> ‘Population, households and dwellings’ section.

It’s that easy!
If you want to know more about your council area, check out the .id demographic and economic tools already available in the demographic resource centre.
If your council doesn’t currently subscribe to .id’s products, click here to learn more about how we can provide a comprehensive demographic and economic resource library for council decision making, strategic planning, business investment, grant funding and much more…


.png)
.jpg)


