Compromising on consistency: The risk in using public forecast data alone
If you're planning infrastructure or services or making an investment or location decision, at some point you will need a population forecast to help you understand how many people will live (or, in other words, how much demand there will be) in a given area in the years to come.
This research typically starts with publicly available forecast data from sources like the Australian Bureau of Statistics (ABS) or state planning departments. These public sources of forecast information are an important starting point, but they come with inherent compromises - one of which is data consistency.
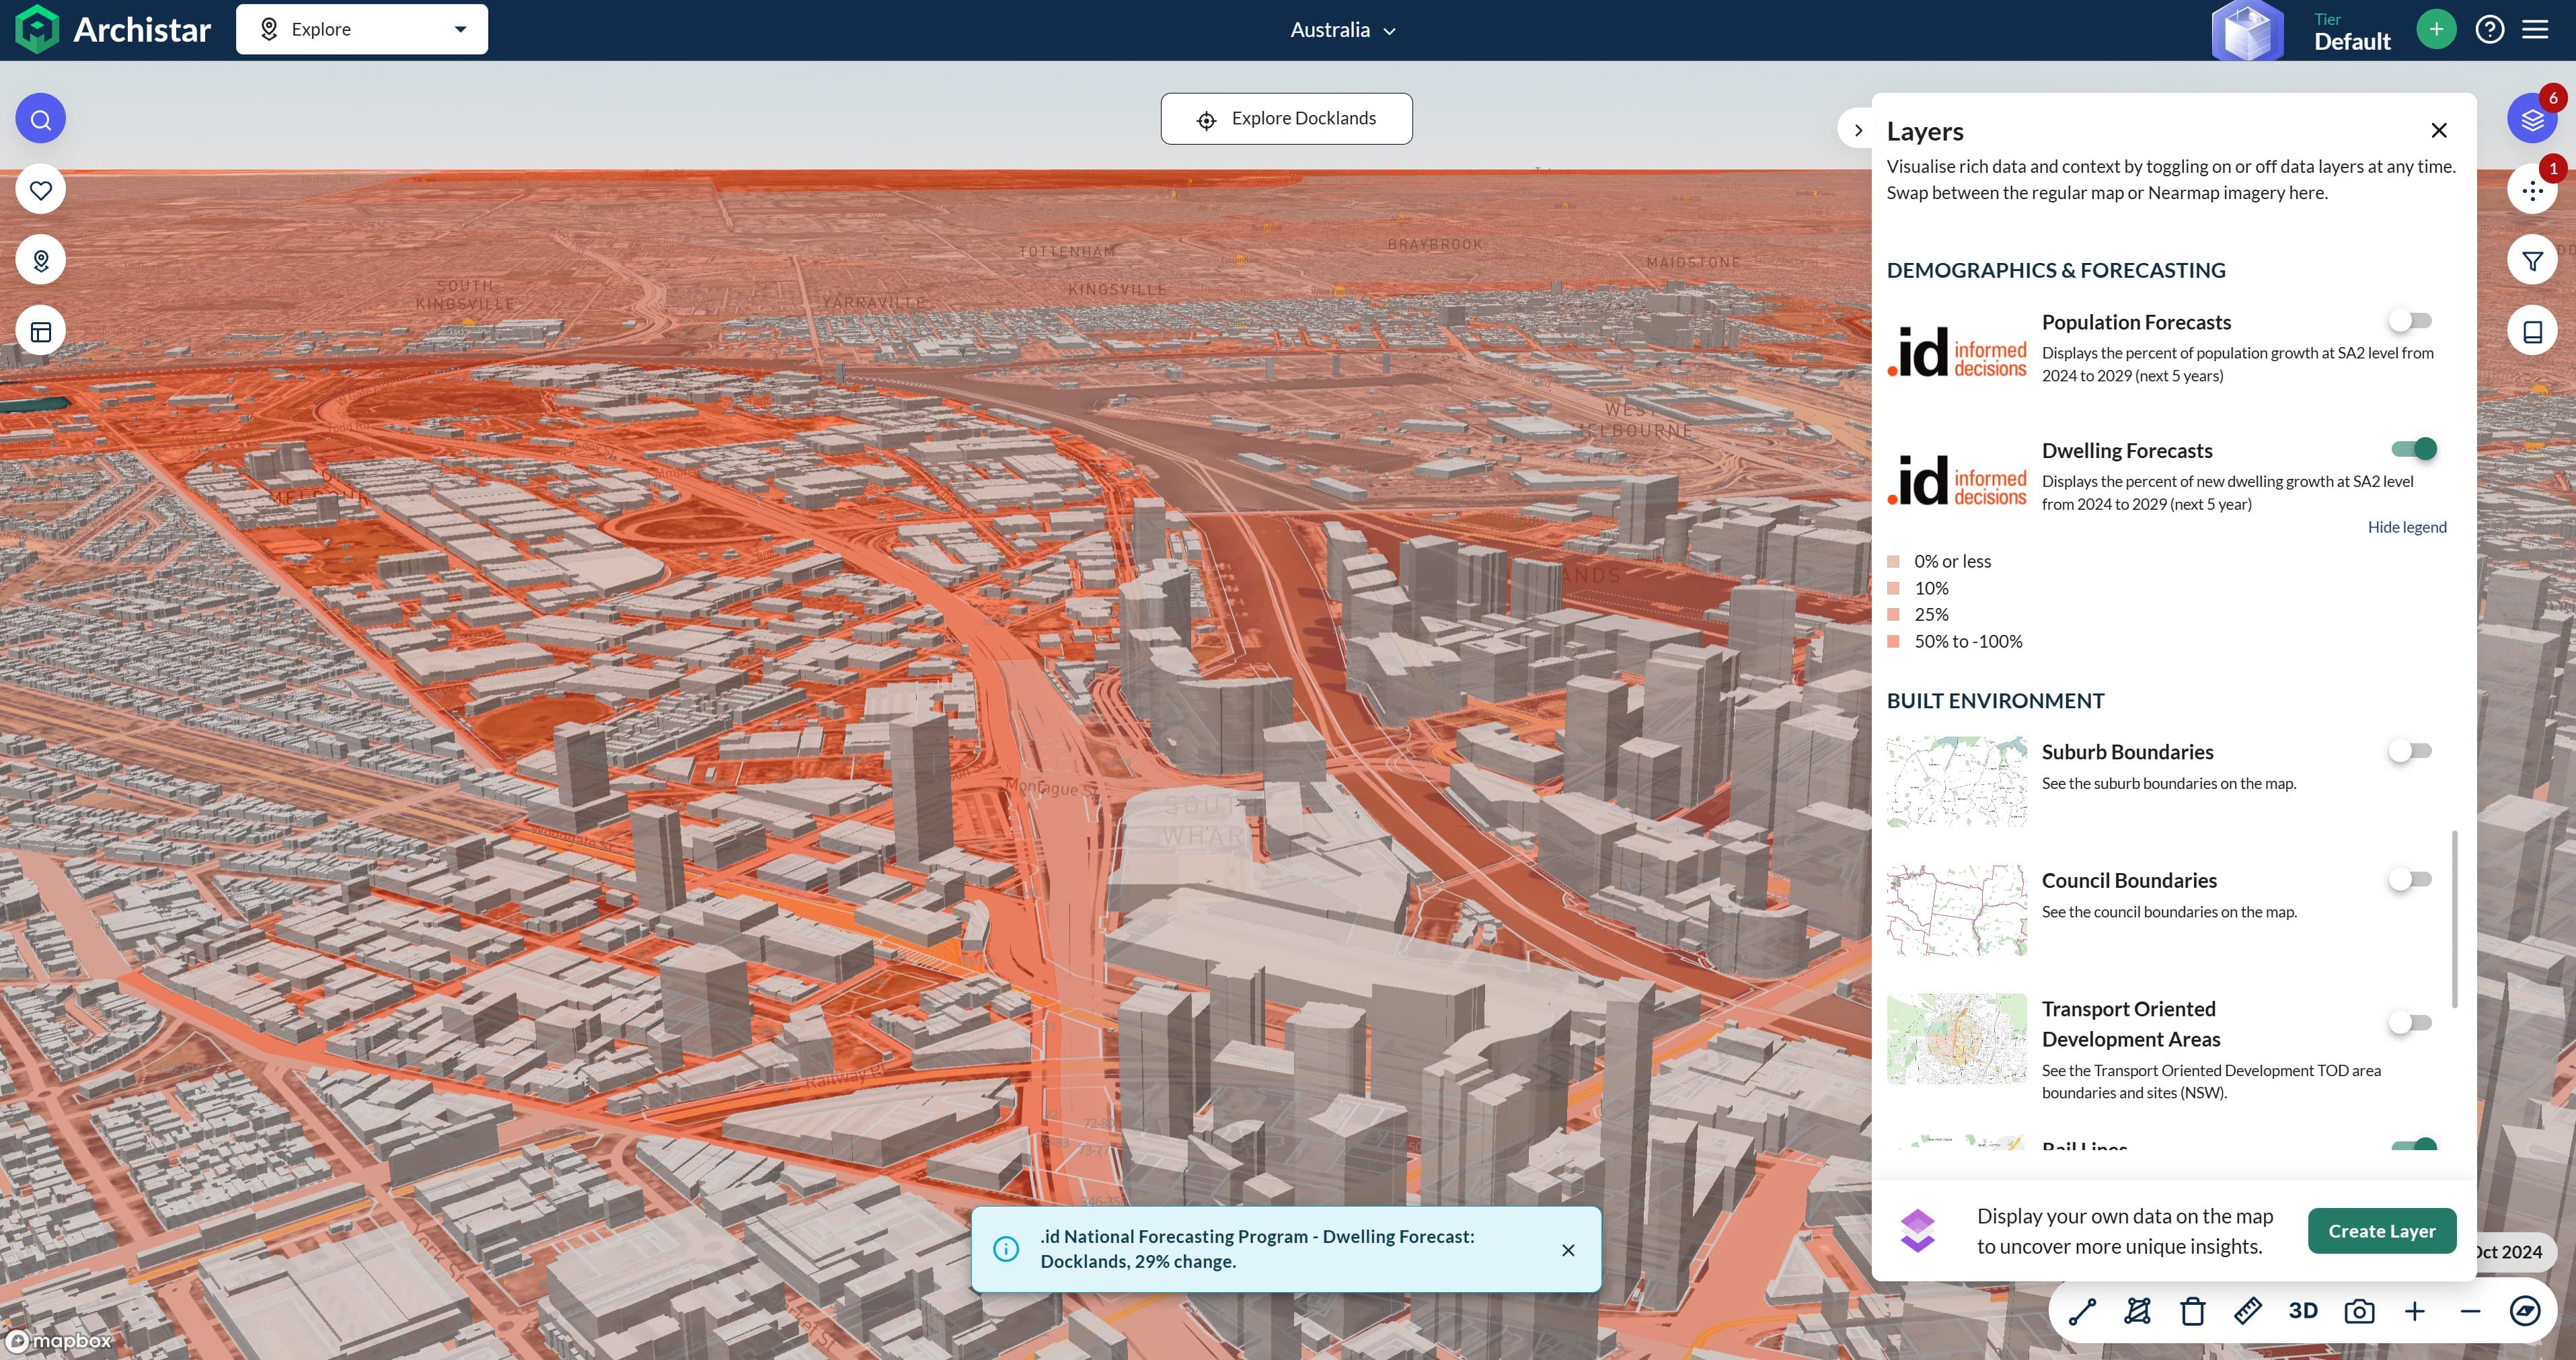
If you're making an important planning or investment decision, an independent forecast helps to calibrate the information from public sources. Our National Forecasting Program provides an accessible, politically independent and consistent source of forecast information for local areas across Australia.
This blog lays out the inherent risks of relying solely on public sources of forecast data and how the National Forecasting Program fits in the mix of forecast information available to you.
Population forecasts inform critical decisions about our future communities
Population forecasts help us make decisions about when and where we build infrastructure and provide services that will be needed by our future communities;
- When and where to locate network services, such as schools, health services, retail stores, bank branches or other location-based services
- Specifying infrastructure for essential services such as utilities by anticipating the timing and scale of future demand, so the right size pipe goes in the ground the first time!
- Providing well located and appropriate forms of housing to accommodate a growing population
- Provision of age-specific services such as childcare, schools and and aged care services by understanding how many people in different age groups will live in an area in the future
To make these decisions, organisations often turn to publicly available data to understand future population growth. Common sources include the Australian Bureau for Statistics (ABS), the Centre for Population and state planning departments.
These are popular sources of forecast information for a number of reasons;
- Ease of access – often immediately available online
- No cost to access the data
- Perception of authority
- Historical pattern of having used these sources in the past
- No knowledge of other sources of population forecast data
Another option is to engage a private consultant to produce a bespoke, one-time forecast analysis. These studies can be expensive, lack the scale to understand a place in its wider context, and these one-off reports can quickly become obsolete as the underlying assumptions and data change.
Let's look at three key risks in relying on public population forecasts.
Public forecast information: the risks
Risk 1: You're not comparing apples with apples
Different sources of forecast information sit somewhere on the following matrix;
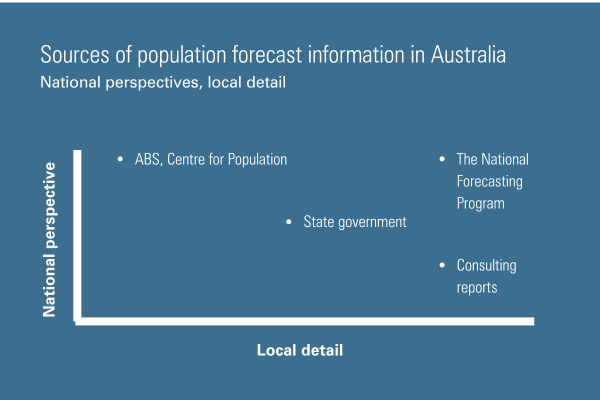
National forecasts such as those from the Centre for Population or the ABS provide national data, but not enough detail to help you make a localised decision.
State government forecasts provide a little more detail, but each state and territory develops forecasts using its own set of assumptions and forecast methodology to predict population growth patterns. They often don’t cover the same timeframes, and might even define geographic boundaries differently. This makes it difficult to confidently compare across different geographies or create a consistent baseline for benchmarking between places.
Essentially, it makes it impossible to “compare apples with apples”.
And so organisations must place significant caveats on the fidelity of the data and any resulting insights. Decision-makers grapple with conflicting data. This erodes confidence in their ability to use the forecasts to choose the best path forward.
For example, consider a national retailer looking to pinpoint the best locations for opening new stores. They need to consider population trends at a national, state and local level. Juggling multiple forecasts with different models, assumptions and results makes an accurate comparison between places extremely difficult.
The National Forecasting Program - regional & national perspective + local detail
The National Forecasting Program is an independent resarch project from .id (informed decisions) that applies a consistent methodology, providing a reliable framework for comparison from national through to local levels. With a singular, dependable data source decision-makers can have more confidence in their comparisons.
Risk 2: Looking at a place in isolation
Publicly available population forecasts focus on projecting the population for a specific jurisdiction. This approach can overlook the interconnectedness of places. Failure to consider broader regional dynamics risks painting an incomplete picture of population growth. This can undermine the accuracy of projections and planning efforts.
Take state government forecasts as an example. Two key assumptions in these forecasts are a) the share of migrants arriving from overseas that will go to each state, and b) the level of interstate migration between each state. If each state has a bullish view of their share of migration from overseas or other parts of Australia, the total forecast for Australia is suddenly more than the sum of the states and territories.
The reality is that no place is an island – what happens in one area influences the flow of people in the areas around it.
Consider a new residential development. It is going to attract people who may have otherwise moved to other developments in neighbouring suburbs. Each developer is going to push for additional services from utilities providers (water, electricity, gas, etc) to meet the growing demands of new residents, arguing that their development will attract the lion's share of population coming to the area. In reality, they can't both be right.
In this case, utility providers need to have an independent forecast that considers both these areas - how much population growth is forecast across the wider region, and how much is forecast to go to each new development, considering all sources of housing supply.
The National Forecasting Program addresses this issue by using a combined top-down AND bottom-up model. We begin with national population trends, and then look at how they cascade down to state, regional and local levels. These 'top-down' regional constraints ensure the forecast for each local area is seen in it's regional and national context. The bottom-up component matches forecast population with housing, ensuring the forecast for a place is only as high as the pipeline of new housing allows.
Summary
While public population forecasts are a convenient starting point for your research, their inherent limitations pose significant risks to decision making.
Our National Forecasting Program provides a single, standardised source of population data. It allows you to drill down from a national to a local level, knowing the assumptions and methodology applied to forecast the future of any place is consistent and comparable.
The information from .id’s National Forecasting Program can be accessed via a several services from .id (informed decisions), ranging from published forecast data and analysis for regions, to one-off reports, data partnerships, tailored forecasting services and specialised consulting.