Who was working from home on Census day 2021?
The COVID-19 pandemic undoubtedly accelerated a transition to working from home. What does the Census tell us about this trend? How did lockdowns and work-from-home rules and recommendations affect the data and how we should interpret it?
Since the COVID pandemic started, working from home has become part of the employment landscape like never before. So much so that it has it has gained its own abbreviation (“WFH”) and even as things return to “normal”, many companies and organisations have adopted a hybrid model for their workforce, with WFH some days a week.
The 2021 Census is a snapshot at a point in time, and has a question “Method of travel to work” which relates to this. These data have just been released as a part of the second release of ABS Census data, so let’s have a look at what it shows about those working from home on Census day.
What does the work from home question in the Census ask?
The method of travel to work asks how people got to work on Census day itself – in this case Tuesday August 10th, 2021. This has always been subject to issues specific to the day. (In past Censuses, where the weather was good, more people walked or rode their bike to work.) But the pandemic took this to a new level in 2021. All of Sydney and Melbourne, large areas of Regional NSW, Regional Victoria and Cairns in Queensland were in lockdown. The conditions of lockdown varied in different jurisdictions, but the recommendation or requirement to “Work from home if you can” was very common in these situations. So that means that for these areas we can’t see the WFH figures for Census day 2021 as indicative of any “new normal” or baseline level going forward. Looking at non-lockdown areas for this might be the best bet. But even there, it’s likely that in some areas (in Victoria particularly), the extended lockdowns have generated a WFH culture which is in excess of that seen in other states, making geographic comparison difficult.
COVID-19 and lockdowns affected results geographically
Australia-wide, 21.0% of the approximately 12 million employed people aged 15+ in 2021 reported working from home on Census day. This was up from 4.7% in 2016 – up by a factor of 4.5. Interestingly, in all previous Censuses back to 1991 this has hovered around 5% of employed population. Despite presumably greater technological ability to WFH, it took a pandemic to actually kick this off.
Of course, results varied enormously based on areas that were in lockdown. With most of the population in NSW and Vic in lockdown, these states recorded the highest percentages of working from home: 31.0% and 25.7% respectively. Western Australia (7.5%) and the NT (4.2%) – where life was going on almost normally – recorded the lowest percentages. However, even in these jurisdictions, the rate of WFH approximately doubled since 2016. This could probably be seen as a baseline level for the non-lockdown states, reflecting an ongoing WFH level for those areas – still higher than anything seen before.
Work from home trends are industry-based
Of course, a lot of jobs can’t be worked from home. This was a major issue during the pandemic, with COVID spread through many essential workplaces. Generally “white collar” professional jobs – knowledge jobs – lend themselves more easily to being done from home compared to manual jobs or service jobs. This is the national WFH percentage by industry division:
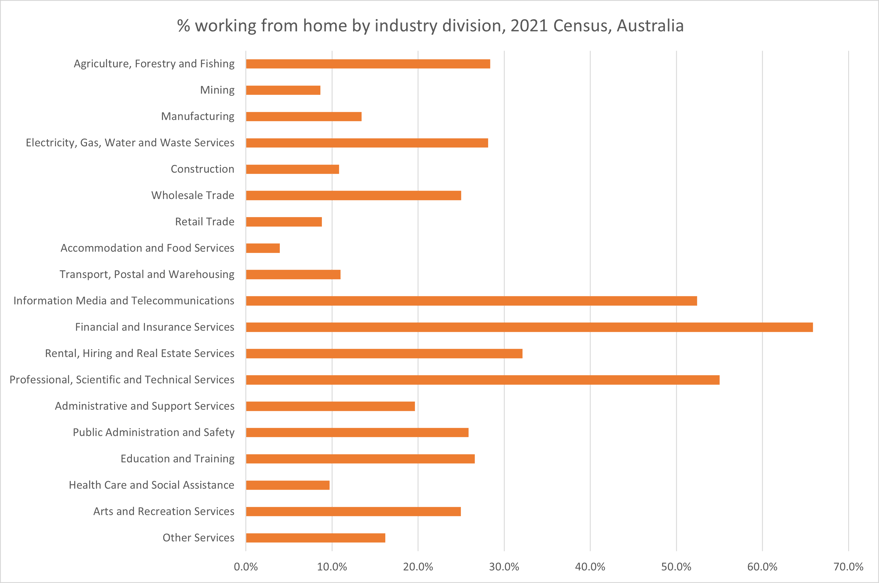
By far the highest percentages are in three knowledge-economy sectors: Finance and Insurance (65.9%), Professional, Scientific and Technical Services (55.0%) and Information, Media and Telecommunications (52.4%). These are the only industry divisions with greater than 50% WFH on Census day. This is likely to be a mixture of reasons. Obviously these are more high-tech industries, dealing in information, usually via networks and can be done online, but (particularly for Finance and Insurance) the jobs are also largely located in Sydney and Melbourne, which were of course in lockdown and required WFH.
Agriculture, Forestry and Fishing seems high at first glance – 28.4% – until you think about it: this includes farmers working on their own farms, where they also live, and hasn’t changed much over time.
The lowest percentage by far is Accommodation and Food Services (3.9%), which includes all cafes and restaurants. Most jobs in this sector can’t be worked from home, and also many of these establishments were shut during lockdowns. It’s no coincidence that Accommodation and Food Services has the highest percentage (24.9%) of its workforce who were employed but did not go to work on Census day. This will largely be due to lockdowns, but the industry does also have a high rate of part-time work even in normal times, which can inflate this number. The next highest industry for “Didn’t go to work” was Arts and Recreation Services, which was also well known to be heavily impacted in the pandemic. However, this industry had a relatively higher WFH rate as well (25.0%).
Where is the work-from-home capital of Australia?
Sydney areas totally dominate the WFH numbers – even lockdown fatigued Melbourne can only rustle up 3 LGAs in the top 20 – the first being the City of Yarra at #11. This table shows the top 20 LGAs by percentage of residential population working from home on Census day.
These are also mostly fairly high socio-economic areas, with a lot of residents in “white collar” jobs: high proportions in professional, finance jobs etc. Perhaps ironically, outer suburban areas with long commutes, which could benefit the most from WFH, are well down the list due to the high proportion of “in-person” jobs. Areas like North Sydney, Mosman, Woollahra in Sydney and Yarra, Port Phillip and Stonnington in Melbourne are all close to the city with relatively short commutes but make up the largest share of those working from home.
You can also use the interactive map below to explore for your own area.
Work-from-home is a part of the Method of Travel to Work Census dataset which is also important for transport planning (a challenge when most other transport modes declined due to the large share working from home). This is a part of both the .id community profile (profile.id) and economic profile (economy.id), and is in the process of being updated for all clients. To be notified when new topics are updated on your .id toolkit, don't forget to subscribe to our New data and features page.
Glenn - The Census Expert
Glenn is our resident Census expert. After ten years working at the ABS, Glenn's deep knowledge of the Census has been a crucial input in the development of our community profiles. These tools help everyday people uncover the rich and important stories about our communities that are often hidden deep in the Census data. Glenn is also our most prolific blogger - if you're reading this, you've just finished reading one of his blogs. Take a quick look at the front page of our blog and you'll no doubt find more of Glenn's latest work. As a client manager, Glenn travels the country giving sought-after briefings to councils and communities (these are also great opportunities for Glenn to tend to his rankings in Geolocation games such as Munzee and Geocaching).