Australia’s birth rate declines to a record low in 2020
A review of the 2020 Australian Births data, breaking down some of the implications of a record low fertility rate and addressing misinterpretations regarding the impact of COVID-19 on these numbers.
The latest births numbers are out from the ABS, and they show that Australia’s total fertility rate has declined to a record low in calendar year 2020, of just 1.581 babies per female. This rate has never been seen before. Even the number of births, which tends to increase with higher population has fallen to 294,369 births registered in 2020. This was the lowest number since 2007. This comes at a time when our borders have been closed, resulting in minimal overseas migration. Both these factors now contributing to record low population growth.
2020 births don’t reflect COVID-19
There has been much talk of a potential “post-lockdown baby boom”. Then, following this data release, there has been some media discussion of the reverse: “COVID uncertainty” contributing to this record low fertility rate. In reality, COVID-19 plays very little part in the numbers released. These figures relate to children born in 2020, meaning they were conceived in March 2020 or earlier. COVID-19 was only just starting to impact life in Australia in March 2020. The trends we’re seeing are largely a continuation of an existing trend from before the pandemic started.
Australia’s birth rate has been declining since 2014
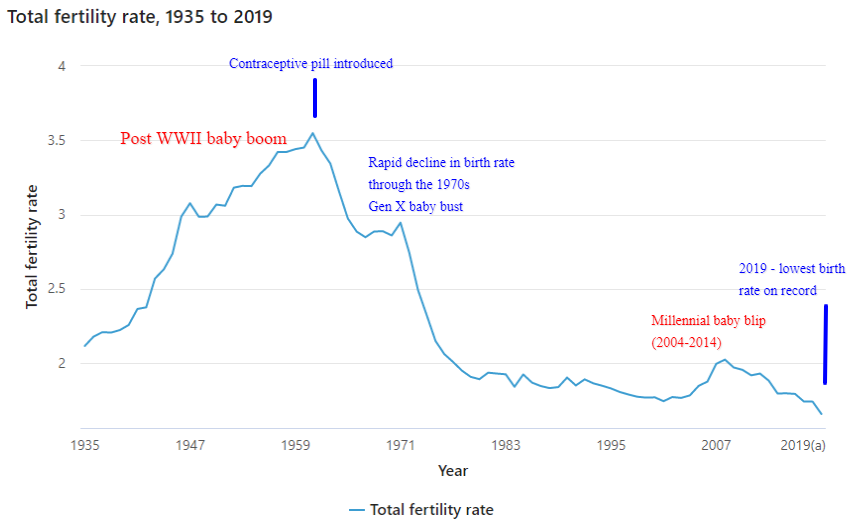
Here is the chart from ABS (annotations by .id) of the fertility rate going back almost 90 years which really puts it in perspective.
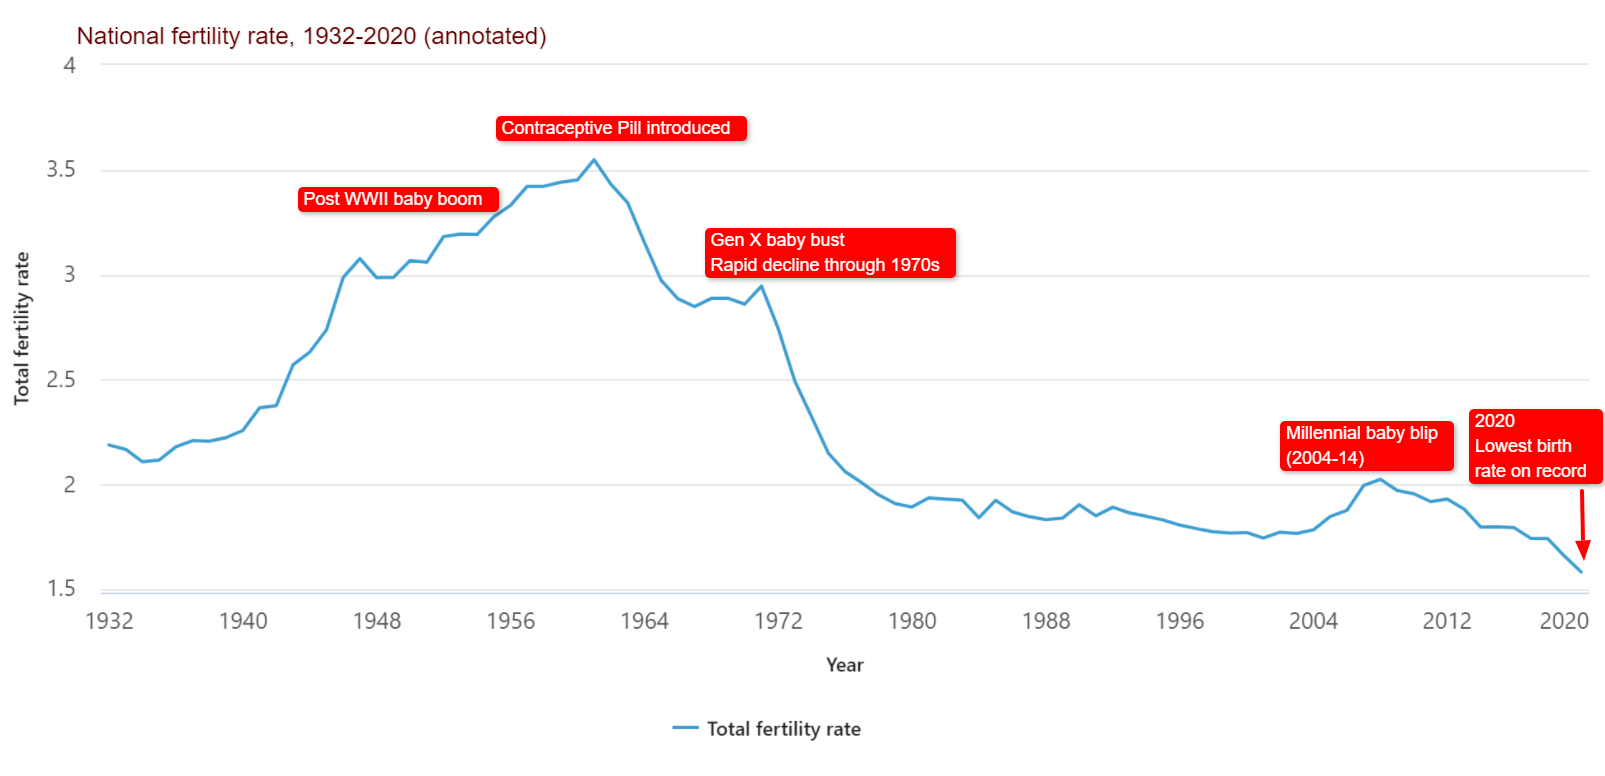
Source: ABS – Births, Australia, 2020, annotations by .id (informed decisions)
Remember that the Total Fertility Rate (TFR) is the estimate of the number of babies each woman has on average, if the age-specific fertility rates in the given year applied through her whole life. So for 2020 that was 1.58 babies per female. At the peak of the post World War II baby boom (where we get the term “Boomer” from) around 1961, the fertility rate was around 3.6.
“Replacement level” is generally around 2.05 to 2.10, the idea being that each woman needs to have two children to replace both parents, and a small factor for infant mortality (which is very low in Australia). We’ve only approached this level once in the past 40 years: in 2008 when the fertility rate was 2.02. Most of the decline in birth rates occurred through the 1960s and 1970s, but this further decline over the past 7 years is quite significant, though not as steep as that seen from 1970 to 1980.
Fertility rates vary across Australia
The birth rate does vary from state to state, and considerably across local areas as well. The Northern Territory, with it’s large Indigenous and much younger population, has the highest fertility rate at 1.84 – still a way off replacement level. The NT and Tasmania were the only two jurisdictions to record an increase in the number of births between 2019 and 2020. Victoria has the lowest fertility rate in 2020 – just 1.43 – and also the largest decline in rate of any state or territory.
Source: ABS – Births, Australia, 2020
These birth rates are still higher than many other developed countries, though Victoria’s rate is getting down towards the level of Japan (1.36) or Italy (1.27). Generally worldwide, it’s still the developing world where the highest birth rates are to be found, particularly in Africa.
Women continue to have babies later in life
Another way of looking at fertility is to break it down by age. This chart shows that the decline in fertility over the last 45 years is not equal across all age groups. In fact, compared to 1975, there is a much higher fertility now among women in their late 30s and early 40s. But there has been an enormous drop among early 20s women, declining by a half to two-thirds in the same timeframe. This is where the main fall in the overall birth rate is coming from.
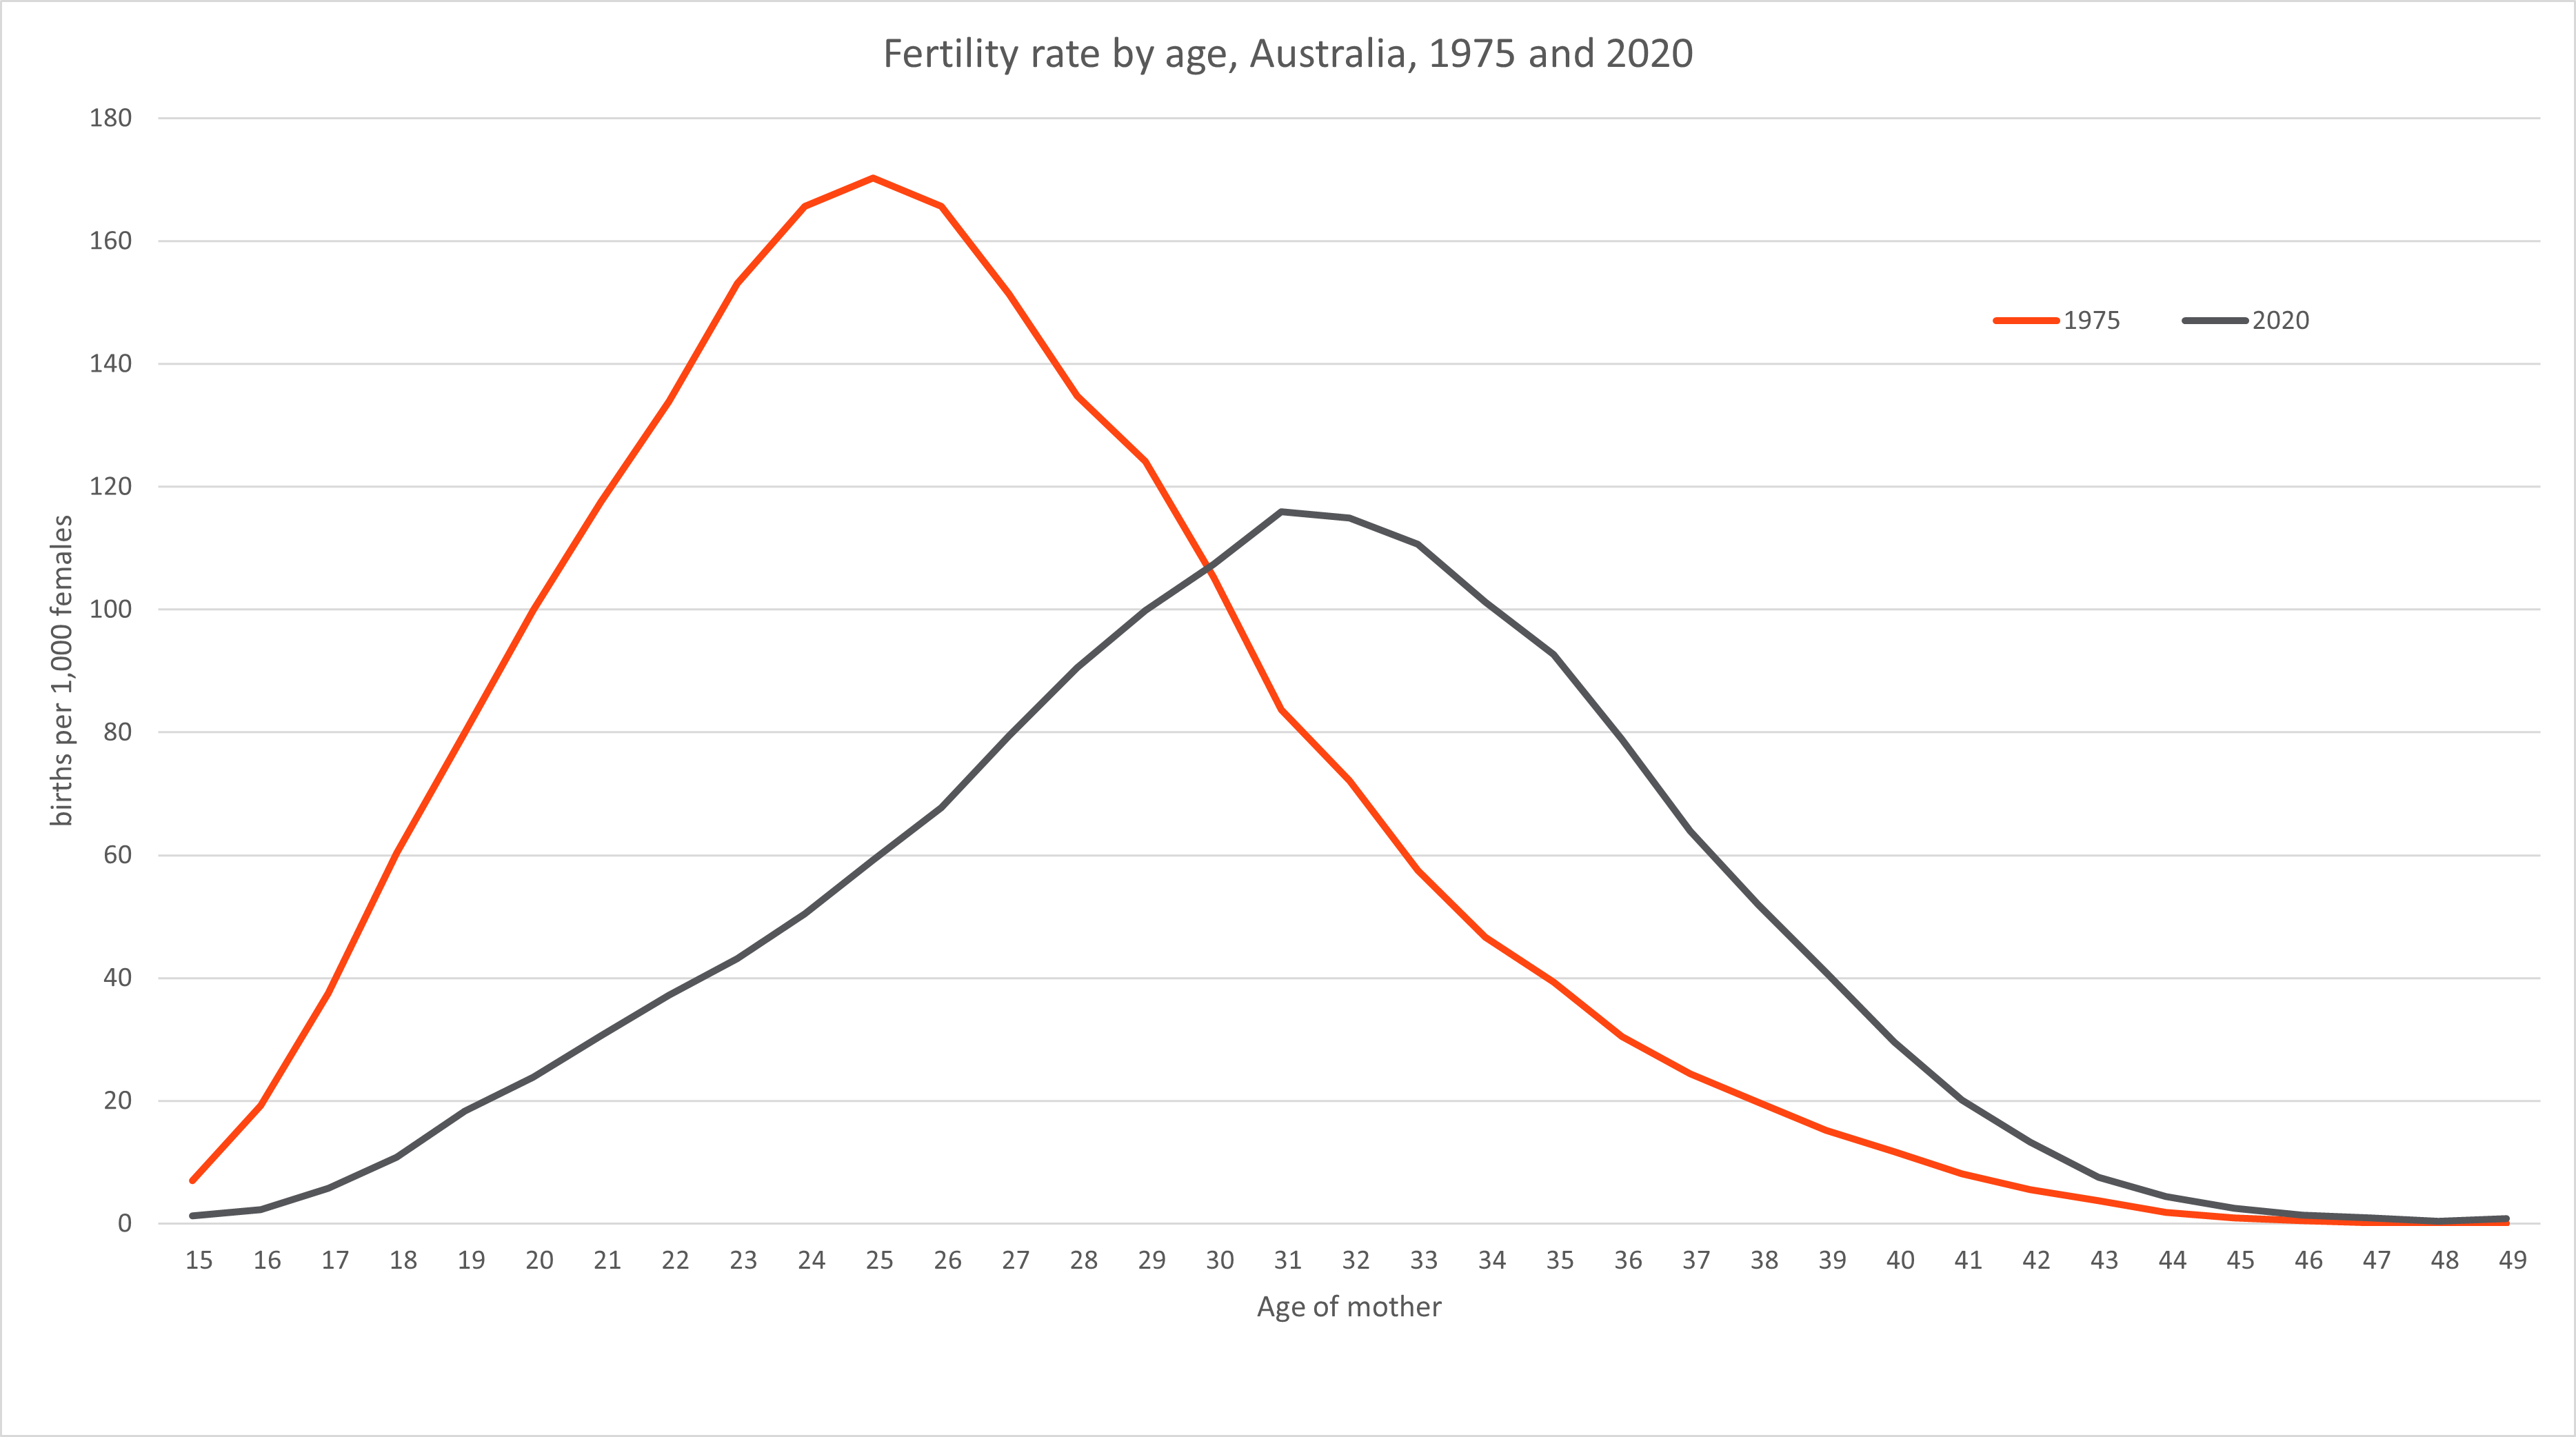
Source: ABS – Births, Australia, 2020
Birth rates inform local population forecasts
Within Australia there are large variations at a local level – generally rural areas have higher birth rates (but often less women of child bearing age, and so lower numbers of births) and urban areas are lower, except for the urban fringe where people move to have children. I’ll write a bit more about regional variations in the next blog on this topic. But these birth rates are an important input into our population forecasts. Nationally over the past decade or so, natural increase (births minus deaths) has made up around 1/3rd of Australia’s population growth. Now, with low migration, it’s a higher percentage of a low growth rate, so when forecasting a local area it’s vitally important to know how many babies people are having. This is factored in every time we do a forecast – and there is a derived birth rate for every small area (suburb or town), not just the LGA overall.
Feel free to contact us if you’d like more information about how we use the births and deaths data in population forecasting and profiling.
Glenn - The Census Expert
Glenn is our resident Census expert. After ten years working at the ABS, Glenn's deep knowledge of the Census has been a crucial input in the development of our community profiles. These tools help everyday people uncover the rich and important stories about our communities that are often hidden deep in the Census data. Glenn is also our most prolific blogger - if you're reading this, you've just finished reading one of his blogs. Take a quick look at the front page of our blog and you'll no doubt find more of Glenn's latest work. As a client manager, Glenn travels the country giving sought-after briefings to councils and communities (these are also great opportunities for Glenn to tend to his rankings in Geolocation games such as Munzee and Geocaching).