Bushfire preparedness with demographics
Local governments play a key role in protecting and preparing their local communities when it comes to bushfires and other natural disasters. In this blog, Nenad demonstrates some of the ways we at .id work with our local government partners to support them in preparing for times of crisis.
Knowing the demographics of your local government area helps with bushfire planning. We are again extending our expertise and assistance to empower our local government clients and partners, by doing what we do best – understanding people and communities. We offer free tutorials on how to use Social Atlas to identify vulnerable communities when planning for emergency management and to understand the different needs the communities within your LGA have – in terms of evacuation, communication and preparedness. If you’re interested in booking one of these tutorials, please feel free to organise a short training session with me.
You might recall reading a similar blog from me last year when after a year of everything being related to Covid-19, Australia was suddenly entering another bushfire season. With the memory of the devastating 2019/20 bushfires still fresh in many Australians’ minds, we were fortunate that our 2020/21 season turned out to be mild. Even with a bushfire outlook for the 2021/22 season likely to be mild in parts of Eastern Australia due to a La Niña weather pattern this summer, the risk of bushfires remains high in Western Australia.
Demographic information improves emergency management
In preparing for an emergency such as a bushfire, understanding the demographic and socioeconomic makeup of a place can be as important as knowing which alternative roads to use or what kind of prevailing winds are expected during a fire event. Some areas will be more resilient than others, some areas will be composed of a more vulnerable/at-risk population than others and some areas will require different communication and broadcasting methods to ensure messages and instructions are received quickly and clearly. Acting quickly in bushfire emergencies saves lives.
When thinking about emergency management plans or similar, one of the first places we go is the Social Atlas (atlas.id) tool (click on the image below to see a live example).
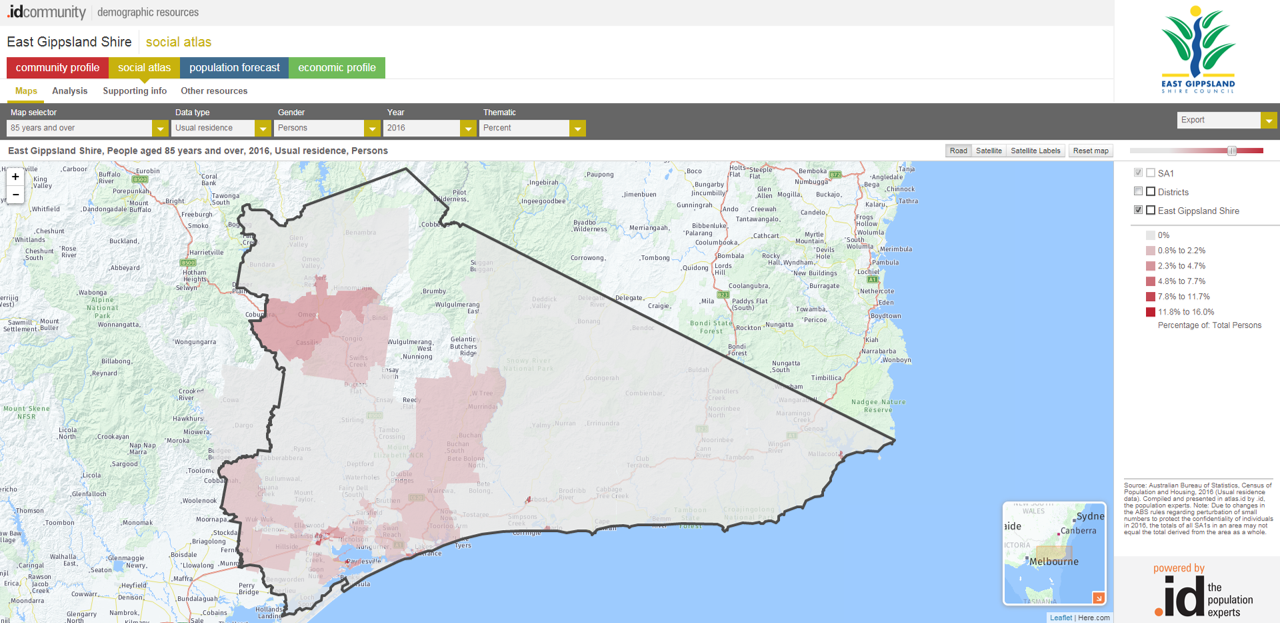
East Gippsland Shire Social Atlas – people aged 85 years and over
The Social Atlas maps key demographic characteristics within your municipality, down to a small geographic level. We have Social Atlases in both Australia and New Zealand. From the middle of next year, Australia’s 2021 Census data will be added to all 190+ Social Atlases.
While the Social Atlas tool has more than 100 different demographic and socioeconomic datasets for each local government area, not all of these are applicable or meaningful in emergency management. Below is a list of Social Atlas datasets which are particularly useful in emergency management planning.
Useful Social Atlas functionality
Social Atlas has several techniques and functionalities which enable users to obtain and understand information and then export and share those findings in plans, reports or other means of communication. Click on the bold orange text to view animated GIFs of functionality.
- Export maps – for use in presentations, reports, etc.
- Export data for entire LGA – for any of the 100+ datasets. Useful for people who want to use the data in third-party software such as geographic information systems, dashboards and interactive tools.
- Catchment creation – by selecting relevant geographic areas such as a community or corridor/area which might be at risk of fire. Data specific to the catchment (selected areas) can be exported.
Limitations and constraints
The Social Atlas is a useful tool with multiple applications, however, there are some limitations when using the tool in emergency management planning. While our New Zealand users have access to the more recent 2018 Census, the current Australian data is from 2016, with the 2021 Census data becoming available in June 2022. Many demographic characteristics do not change much over a five year period (such as age/household make-up, population density or some diversity characteristics) but some, such as “internet connections”, have probably changed drastically.
Connecting to the internet in 2016 most commonly meant a household connection to the internet and having devices connect to that household internet source, whereas in 2020 many households may not have a “household connection” but their occupants will still have access to the internet via mobile devices. Unfortunately, the ABS has removed this question from the recent Census altogether but we will endeavour to find this information elsewhere.
Another limitation of using this data in emergency management is in areas where a significant change to the population may have occurred since 2016 as a result of a disaster. For example, any communities affected by bushfires in late 2019/early 2020 are likely to not be accurately represented in Social Atlas statistics. As many experts involved in emergency management already know, desktop information is important but “ground-truthing”, site visits and access to more recent data such as council occupancy or demolition certificates at the address level – and any other data indicative of current settlement patterns – is key to successful and accurate emergency management.
Advanced emergency management analysis
.id has expertise in providing demographic information and conducting sophisticated spatial and demographic analysis for emergency management purposes. The Social Atlas tool is part of a wider set of services. Some of our partners need more in-depth or specialised information, or some additional spatial analysis to enhance their emergency management capability. See this case study for an example. Here are some of the analysis techniques and services we have created in consultation with Local Governments.
- Catchment creation/analysis – using isochrones/road network catchment analysis and demographic analysis of population within catchments.
- Specialised combinations of data – (e.g. older lone persons with no access to the internet or older lone persons with no motor vehicle).
- Identification and analysis of high-risk communities – change over time, likely forecasted growth, etc.
- Creating large, high-resolution maps – for use in civil defence/emergency management HQ.
- Assessment of cumulative vulnerability – Understanding areas with cumulative vulnerabilities for emergency management purposes. This type of analysis involves combinations of several demographic characteristics to show areas with several vulnerabilities to bushfire risk, for example – communities with a high proportion of lone 85+ year olds, and a high proportion of households with no motor vehicle and a high proportion of residents with a need for assistance due to disability. Click this link for a full-screen interactive example of how demographic information can be used for emergency management risk assessment in Regional Victoria.
Familiarise yourself with Social Atlas
Converting data into knowledge is .id's core mission. Whether our policymaker partners are planning for the long-term or addressing immediate needs, we pride ourselves on being here to help. So if you, or someone's your organisation is involved in emergency management, we encourage you to explore your council area's Social Atlas tool and if you'd like to book a demo of how you can use this tool in emergency management and to talk to us about anything else we could help with, please use this link to easily book a 30-minute presentation.
Nenad Petrović
Nenad’s background is in geosciences and geographic information systems. At .id, Nenad has experience as both as a demographer and population forecaster. His areas of expertise are place-based analysis, identifying spatial patterns in demographic trends, community profiling, catchment analysis and an understanding of role and function of different communities.


